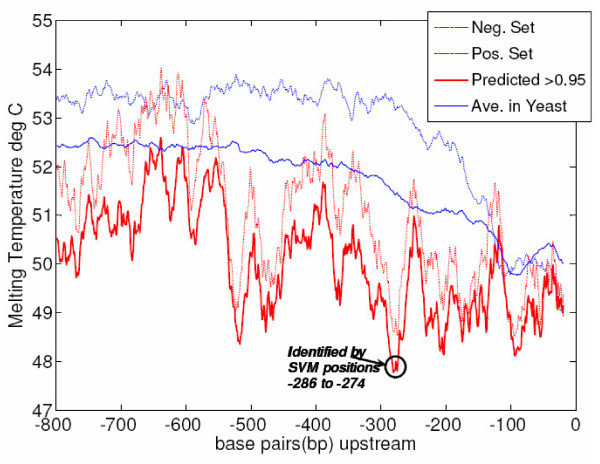
Figure 7.
YJL110C Target Melting Temperature Plot. Using a 20 bp window for DNA melting temperature calculation, temperature plots are presented for the average over all 5571 yeast genes (solid blue), positive targets for YJL110C (dashed red), negatives for YJL110C (dashed blue), and at Platt score P ≥ 0.95 (solid red). Targets of YJL110C have a lower melting temperature than the average or negative set gene. SVM feature ranking correctly identifies the window positions in which the target melting temperature is most unlike that for negative genes, suggesting altered promoter structure of the targets, which is conserved at positions -286 to -274.

