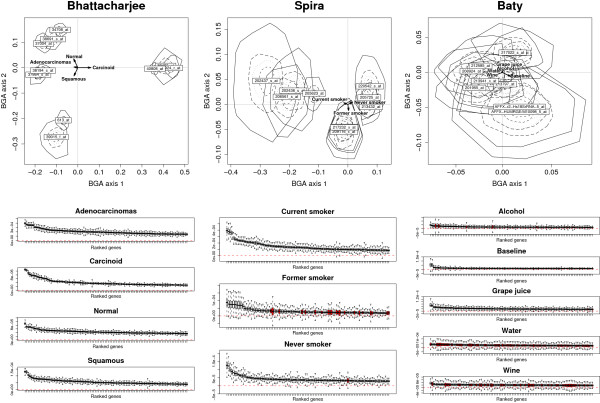
Figure 2.
Stability of gene contributions using bootstrapping. Uncertainty plots in the upper panels display for each data set the coordinates of the 10 most discriminating genes after partial bootstrap (500 repetitions) in the first two axes of BGA. Convex hulls containing 25%, 50%, 75% and 100% of the points are used to represent the spread of gene coordinates. The directions of class centroids are represented by arrows. In the lower panels, sensitivity boxplots show the distributions of gene contributions. Genes are ranked from left to right according to their discriminating power. The zero threshold is depicted as a dashed line. Gene distributions where more than 5% of values are below 0, are represented as plain boxplots.

