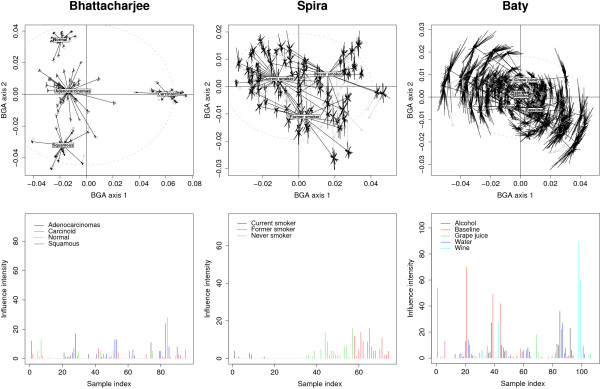
Figure 3.
Detection of influential observations and outliers by jackknifing. Stability plots in the upper panels show the shifts of sample coordinates induced by jackknifing in the first two axes of BGA. The dashed ellipse delineate 2 standard deviations of the sample coordinates on the displayed axes. Barplots in the lower panels show how many times samples were declared as significantly influential.

