
Fig. 7. FRET analysis of protein-protein interactions.
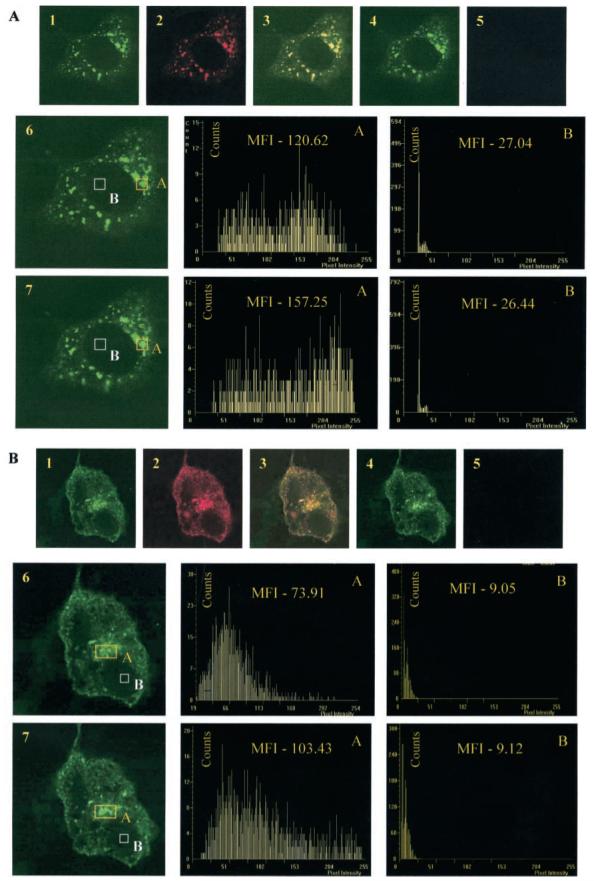
A, homodimerization of the ORF3 protein. COS-1 cells were cotransfected with pECFP-ORF3 and pEYFP-ORF3 and imaged for ECFP (pseudocolored green) or EYFP (pseudocolored red) before (panels 1 and 2) and after (panels 4 and 5) EYFP photobleaching. Panel 3 shows a merge of panels 1 and 2. Histograms of the mean fluorescence intensity (MFI) of ECFP in the area of colocalization (A) and in the region where the two proteins do not colocalize (B) are shown either before (panel 6) or after (panel 7) photobleaching of EYFP. B, interaction between the ORF3 and Pyst1 proteins. COS-1 cells were cotransfected with pECFP-ORF3 and pEYFP-Pyst1 and imaged for ECFP and EYFP as above. Mean fluorescence intensities were determined as described under “Experimental Procedures.” Representative images are shown.