
Figure 1.
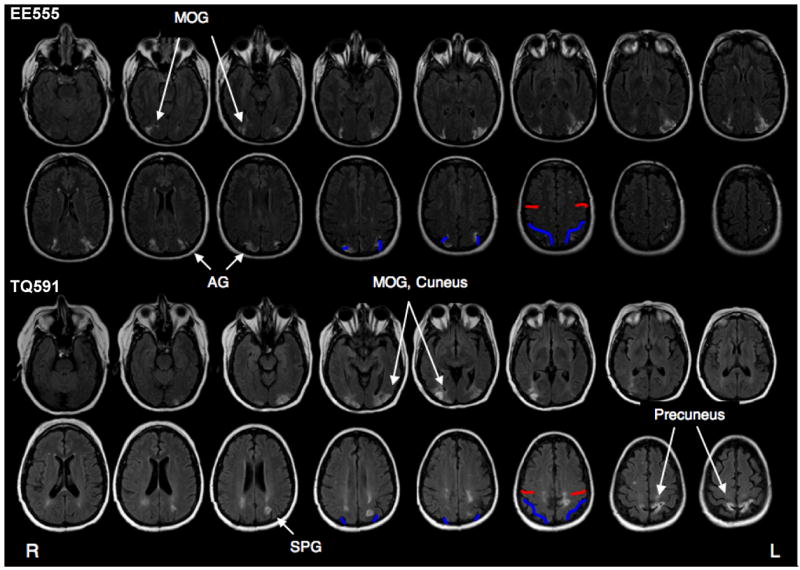
Patient Lesion Traces. Lesions are shown on T2 fluid-attenuated inversion recovery (FLAIR) images in which the lesions appear as white higher intensity patches in parietal regions. Anatomical landmarks are marked in red and blue. Red lines mark the central sulcus, blue lines mark the intraparietal sulcus. Radiological convention is followed (left is on the right). Abbreviations: AG = angular gyrus, MOG = middle occipital gyrus, SPG = superior parietal gyrus.