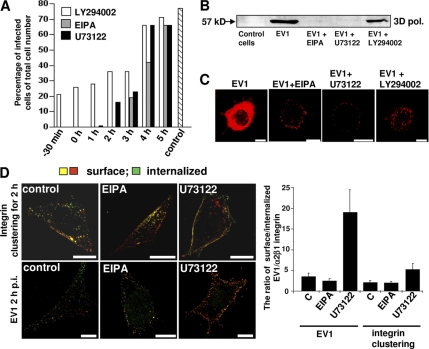
Figure 5.
EV1 infection is blocked by macropinocytosis inhibitors. (A) EV1 was first bound on cells on ice, nonattached virus was washed away and receptor-bound virus was allowed to internalize at 37°C for 7 h in total. The drugs (EIPA, U73122, and LY294002) were added at different times during the infection. Infected cells were counted based on the emergence of new viral capsid proteins in the cytoplasm from fluorescent labeling. The results were counted from 150 to 200 cells for each case and the experiment was repeated once with similar results (control, infection without drugs). (B) Emergence of 3D polymerase as a proof of replication startup was visualized by SDS-PAGE and Western immunoblotting. Drugs were present during the whole 7-h period. (C) The localization of EV1 capsid proteins was visualized after different drug treatments 7 h p.i. Images are confocal sections through the central area of the cells. (D) Differential staining of the internalized and surface-bound α2β1 integrin and EV1. Drugs were added 30 min before the assay, and they were present during the 2-h internalization period. EV1 or α2β1 integrin were immunolabeled before and after permeabilization to reveal the surface-bound and intracellular proteins, respectively. The surface-bound proteins show both red and colocalized voxels (green and red together), whereas green alone represents the internalized proteins. The ratio of surface/internalized EV1 or α2β1 integrin was determined using the internalization algorithm in BioImageXD software (see Materials and Methods for details). (Higher ratio means lower amount of internalization.) Bars, 10 μm.

