Figure 8.
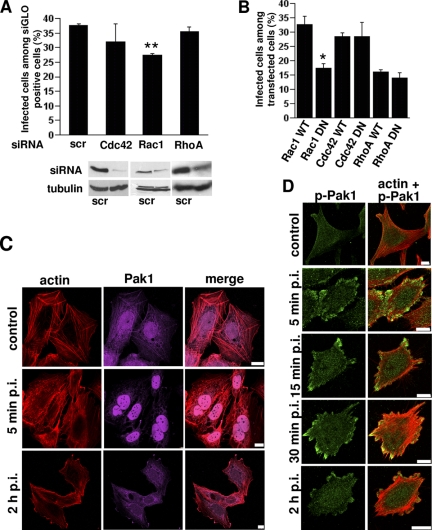
EV1 infection is regulated by Rac1 and actin dynamics. (A) RhoGTPases Cdc42, Rac1 and RhoA were knocked down using specific siRNA or control siRNA (scr) in the presence of a siGLO transfection marker. EV1 infection was quantified in these cells 6 h p.i. The result is a mean value of two independent experiments (±SE). Together, 300–400 siGLO–positive cells were counted for each construct. The knockdown effect was verified by Western blotting using tubulin as loading control. (B) The effects of Rac1, Cdc42, and RhoA were also verified by EV1 infection assay in cells transfected with WT and DN constructs. The result is a mean value of three independent experiments (±SE). (C) Pak1 (magenta) and actin (TRITC-phalloidin; red) were visualized after EV1 infection for 5 min and 2 h p.i. Bars, 10 μm. (D) Phospho Pak1 (green) was immunolabeled and actin (TRITC-phalloidin; red) was visualized after starvation (control) and EV1 treatment of SAOS-α2β1 cells for different times (between 5 min and 2 h). Bars, 10 μm.

