Figure 5.
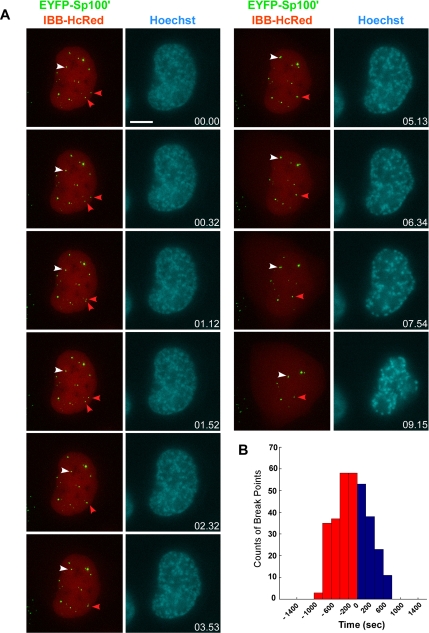
PML NBs dynamics upon nuclear membrane breakdown. (A) Triple stable cell line, CpYsRi89, stably expressing PML-ECFP, EYFP-Sp100′, and IBB-HcRed. An 8-μm Z-stack of 0.5-μm steps is collected every 8 s for 20 min in the YFP and the HcRed channels. A single Z section at the middle of the cell was taken at every time point in the Hoechst channel as the reference image for DNA. Nuclear membrane breakdown was visualized by the release of the HcRed signal from the nucleus into the cytoplasm. The 3D-projected images show that PML NBs are highly dynamic even before nuclear membrane breakdown. White arrowheads, PML NBs with long-distance displacement. Red arrowheads, the fusion of PML NBs. Bar, 10 μm. (B) The change of diffusion coefficient, calculated by a model-free maximum-likelihood estimator (MLE) algorithm, was used to define break points of a single particle track. Six live cell data sets were collected from the CpYsRi89 triple stable cell line. By visualizing the release of the HcRed signal from the nucleus into the cytoplasm, the time point of NEBD for each data set was defined as time = 0 to synchronize and compare timing between the data sets. The majority of the break points occurred before NEBD.

