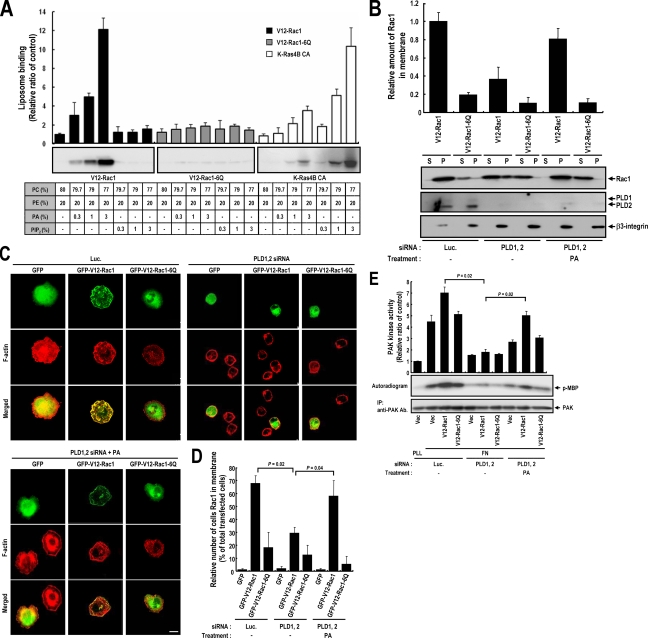
Figure 4.
Rac1 directly interacts with PA via a polybasic sequence in its C-terminal region. (A) Purified isoprenylated Flag-V12-Rac1, Flag-V12-Rac1-6Q, and Flag-Kras-4B-CA mutants were incubated with the indicated liposomes. Liposomes were sedimented, and the pellets obtained were analyzed by Western blotting using anti-Flag antibody. Liposome binding assay results were quantified by densitometry. Error bars represent means ± SD (n = 3). (B) Cells were transfected with the indicated control luciferase or siRNA PLD1 and PLD2. One day after siRNA transfection, cells were transfected with Flag-V12-Rac1 or Flag-V12-Rac1-6Q. After serum starvation for 24 h, cells were detached from culture dishes, maintained in suspension for 3 h, and replated on fibronectin with or without 50 μM PA for 20 min. Adherent cells were harvested and particulate (P) and soluble (S) fractions were isolated. Samples were analyzed by Western blotting using anti-Flag antibody. β3-integrin was used as a membrane fraction marker. Quantitative data concerning the membrane localization of Rac1 were normalized to β3-integrin levels. Error bars represent means ± SD (n = 3). (C) Cells were transfected with the indicated control luciferase or siRNA PLD1 and PLD2. One day after siRNA transfection, cells were transfected with GFP control vector or with GFP-V12-Rac1 or GFP-V12-Rac1-6Q, as indicated. After serum-starvation for 24 h, cells were detached from culture dishes, maintained in suspension for 3 h, and replated on fibronectin with or without 50 μM PA for 20 min. Cells were then fixed and stained with TRITC-labeled phalloidin. Images are single confocal sections (n = 4). Bars, 20 μm. (D) The graph shows quantification of the cells expressing Rac1 in membrane from C. Error bars represent means ± SD (n = 4), 100 cells per group were assessed in each experiment. (E) PAK proteins were immunoprecipitated, and kinase activities in cells treated as described in B were assayed. PAK kinase activity assay results were quantified by densitometry and normalized versus PAK protein levels, and precipitated PAK was visualized by Western blotting using antibodies directed against PAK. Error bars represent means ± SD (n = 3).

