Figure 6.
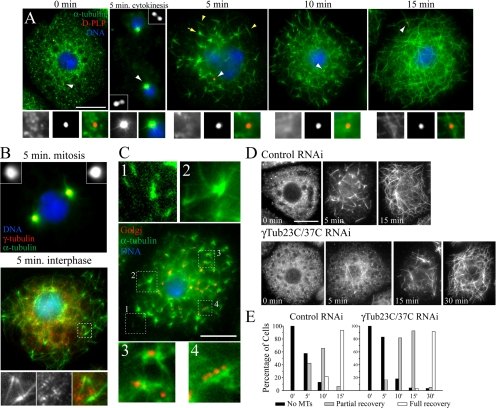
MT regrowth occurs independently of centrioles but is delayed in γ-tubulin–depleted S2 cells. (A) S2 cells were stained for MTs (green), D-PLP centrioles (red), and DNA (blue) at specific time points in a MT regrowth assay. MTs were depolymerized by cold treatment (0 min.) and brought to room temperature to allow polymerization. Cells were fixed at 5, 10, and 15 min. Centrioles (white arrowheads) are shown at higher magnifications in bottom panels (left to right; MTs, D-PLP, merge). A cell in cytokinesis is shown at 5 min with disengaged centrioles (insets). An interphase cell at 5 min contains individual MTs (yellow arrowheads) and tufts of MT foci (yellow arrow). Scale, 10 μm. (B) Mitotic (top) and interphase (bottom) S2 cells after 5 min of MT regrowth stained for MTs (green), γ-tubulin (red, insets), and DNA (blue). The white box (interphase cell) is shown at higher magnification (bottom panel) and denotes a cluster of MT foci (left to right; MTs, γ-tubulin, merge). (C) An S2 cell at 5 min of MT regrowth immunostained for MTs (green), Golgi (red), and DNA (blue). Higher magnifications of (1) individual MTs in the lamella, (2) MT foci, (3) Golgi associated with MT foci, and (4) Golgi punctae along a MT bundle. Scale, 10 μm. (D) Time points show day 7 control and γ-Tub23C/37C RNAi-treated S2 cells stained for MTs during MT regrowth. Scale, 10 μm. (E) Quantitation of MT recovery in the RNAi-treated cells displayed in D.

