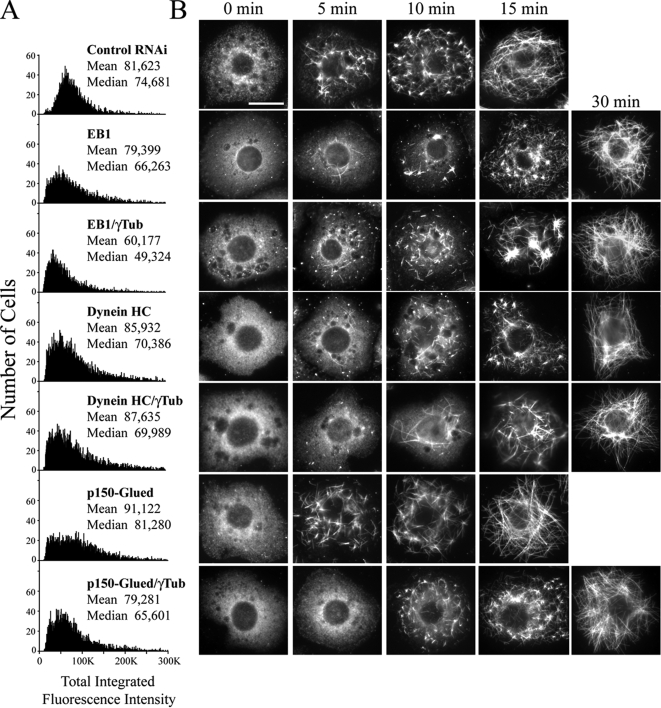
Figure 8.
EB1 or cytoplasmic dynein (DHC) RNAi delays MT regrowth in S2 cells but is not observed with either depletion of the p150Glued component of dynactin or codepletion with γ-tubulin. (A) Distribution histograms of total integrated MT fluorescence intensity at steady state in RNAi-treated α-tubulin–immunolabeled S2 cells using quantitative HTM; (y-axis) cell number, (x-axis) arbitrary units. Approximately 5000 cells were scanned in each treatment that produced a significant difference (p < 0.05) compared with the control RNAi using a nonparametric Kruskal-Wallis one-way analysis of variance followed by a Dunn's post-test. (B) Time points show representative day 6 RNAi-treated S2 cells stained for MTs during MT regrowth. Each row of micrographs is aligned with the dsRNA(s) that were used in A. Scale, 10 μm.

