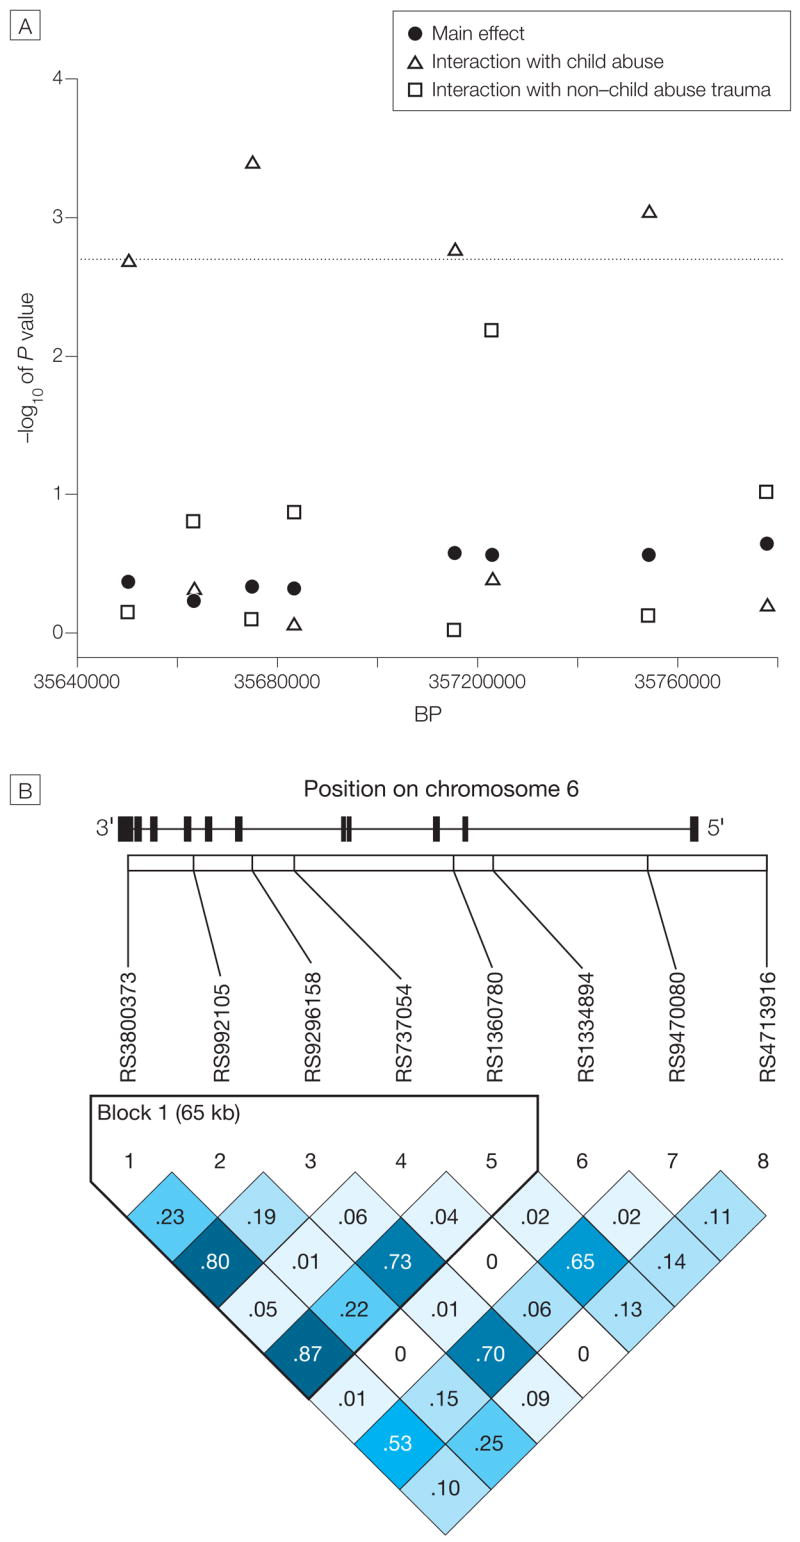
Figure 1. FKBP SNPs and Main Genetic Effect on PTSD Symptoms and Interaction Effects With Non–Child Abuse Trauma Levels and Child Abuse.

SNPs indicate single-nucleotide polymorphisms; PTSD, posttraumatic stress disorder. A, The plot shows the negative log10 of the P value for the main genetic effect (filled circles), the interaction of FKBP5 SNP genotypes and non–child abuse trauma level (open squares), and the interaction of FKBP5 SNP genotypes and child abuse (open triangles) to predict adult PTSD symptoms. The x-axis shows the position of the SNPs on chromosome 6 and the y-axis shows the P value for the respective effects, plotted as the negative log10 of the P value. Dotted line indicates P < .002. B, The position of the FKBP5 gene and its exons (filled rectangles) on chromosome 6 as well as a linkage disequilibrium (LD) plot of all tested SNPs using r2 as the measure of LD is also shown. r2=1 indicates complete LD and is depicted by the darkest shade of blue. r2<1.0 are printed in the respective square for compared SNPs, with darker shades of blue representing higher levels of LD.
