
Figure 2. Effect of parity on object placement.
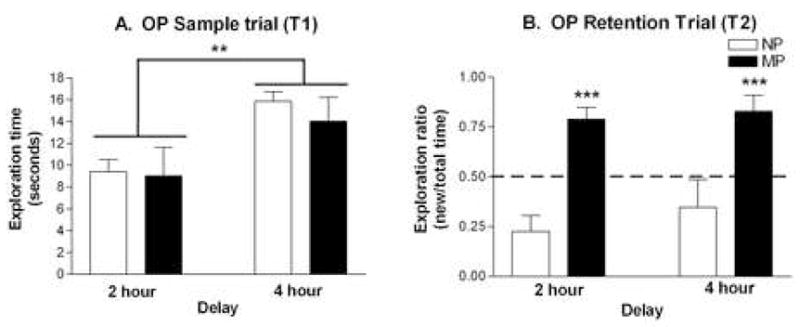
(A) Mean exploration times (± SEM) during the sample trial (T1) is shown for NP (□; n = 8) and MP (■; n = 8) females. Data were analyzed by two-way ANOVA (group × delay). (B) Mean exploration ratios (± SEM) during the recognition trial (T2) is shown for NP and MP females. The exploration ratio is calculated as [time with new object/time with old object + time with new object]. Dashed line at 0.50 indicates chance performance on the task (equal time exploring old and new objects). **p < 0.01; ***p < 0.001.