
Figure 4. Effect of parity on BDNF expression in hippocampus and septum.
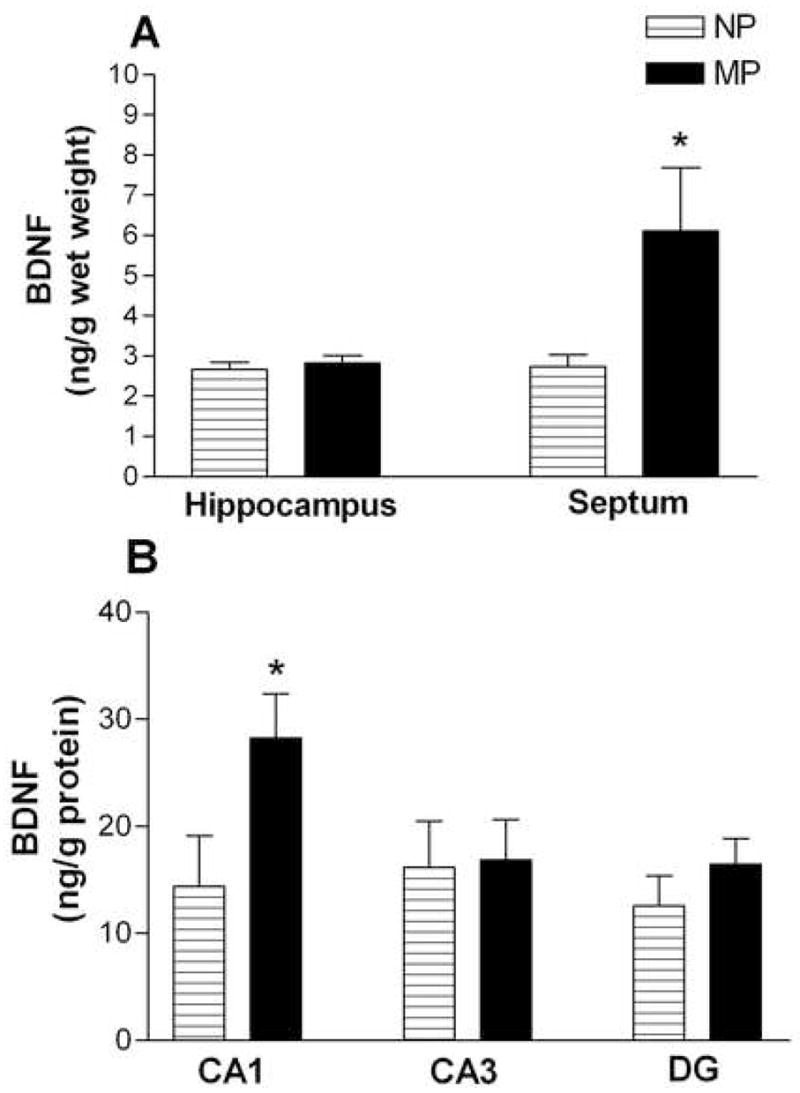
(A) Cohort 1. Mean BDNF concentration (± SEM) in whole hippocampus (left) and septum (right) for NP (□; n = 7) and MP (■; n = 8). Concentrations given are in ng/g wet weight. (B) Cohort 2. Mean BDNF concentration (± SEM) in three hippocampal subregions: CA1 (left), CA3 (middle), and dentate gyrus (DG; right) of NP (□̶; n = 6) and MP (■; n = 8) females. Concentrations given are ng/g protein. Data from each cohort were analyzed by two-way ANOVA (group × region). * p < 0.05.