
Figure 5. Entries into each side during the tests for (A) sociability and (B) preference for social novelty.
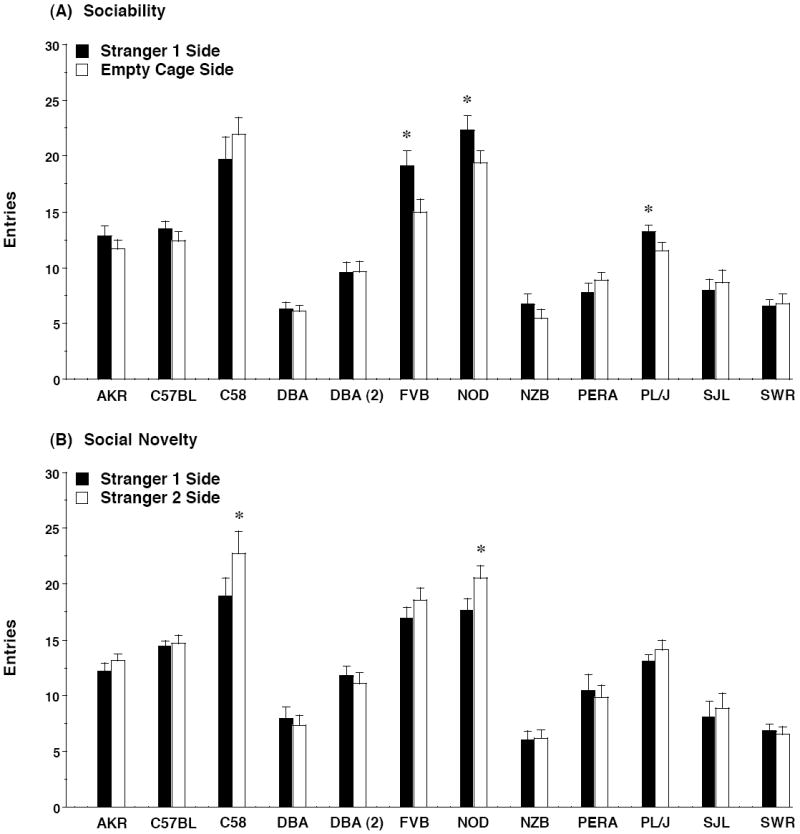
Data shown are mean + SEM for each strain. * p<0.05, within-strain comparison, stranger 1 side different from empty cage side (A) or stranger 2 side (B).