
Figure 6. Time spent in each side during the test for sociability in mice with (A) positive difference scores or (B) negative difference scores.
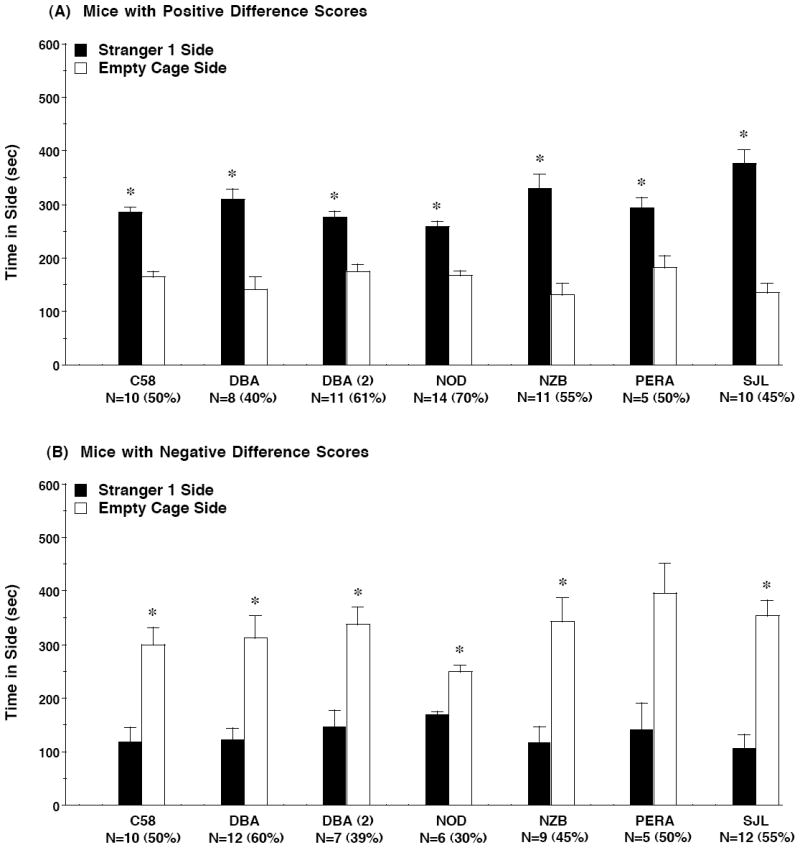
Data were taken from the 6 strains which did not have significant social approach, as shown in Figure 3A. Difference scores were calculated as time spent in side containing stranger 1 minus time spent in the empty cage side. Data shown are mean + SEM. N values indicate number of mice from each group, followed by percent of each group, having either positive or negative difference scores. For all of these strains, only 1 or 2 subjects had difference scores falling between 30 and -30 sec (indicating a 30 sec or less difference between time spent in either side). The exception was the first set of DBA/2J mice, which included 6 subjects with difference scores between 30 and -30 sec (inclusive). * p<0.05, within-strain comparison, stranger 1 side different from empty cage side.