
Fig. 1.
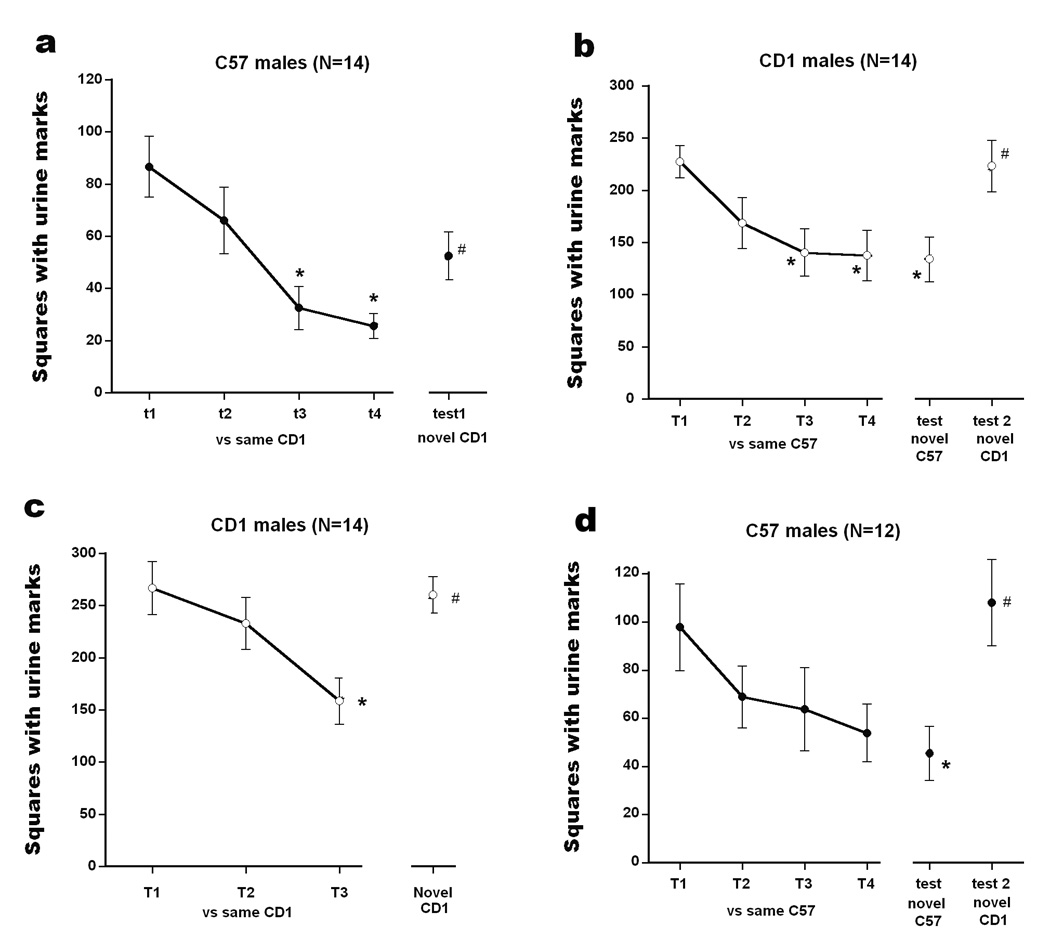
The total number of urine marked squares for (a) C57 males exposed to CD-1 males (experiment 1); (b) CD-1 males exposed to CD-1 or a C57 male (experiment 2); (c) CD-1 males exposed to CD-1 males (experiment 2); and (d) C57 males (experiment 3). For all experiments, the initial block of trials involved exposure to an initially novel stimulus male, in an initially novel situation. All tests with novel males, as marked on graphs, were done in the same, now familiar, situations as the first block of trials. The inter-trial-interval was 24 hour. Data are expressed mean ± S.E.M. Significant differences between trials compared to trial 1, *;p<.05, and to trial 4, #; p<.05 in graph (a), (b), and (d), and to trial 1, *;p<.05, and to trial 3, #; p<.05 in graph (c).