
Table 6.
The violation of the uniformity of dinucleotide representation for purines (R) and pyrimidines (Y) between A, B and combined conformational families as measured by the standardized Pearson residuals
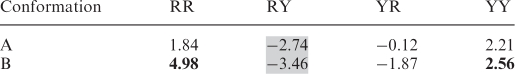 |
The underrepresented sequences are indicated by a gray background, the overrepresented are in bold, both exceeding the critical value of ± 2.50 (the 5% confidence level).