
Table 7.
The violation of the homogeneity of purine (R) and pyrimidine (Y) dinucleotide steps between AI, AII and nonclassified (RestA) conformers in the A-form double helices as measured by the standardized Pearson residuals
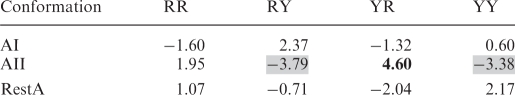 |
The underrepresented sequences are indicated by a gray background, the overrepresented are in bold, both exceeding the critical value of ±2.87 (the 5% level test).