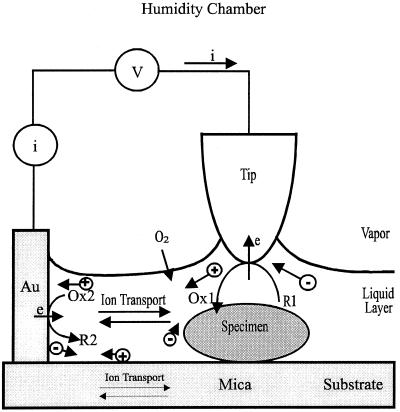
Figure 1.
Schematic diagram for the SECM chamber with controlled humidity, and the EC processes that control the current. The tip was located laterally ca. 1–2 mm away from the Au counter electrode. For illustration purposes, the thickness of the liquid layer is exaggerated to accommodate equations for the various EC processes. V, voltage bias between the tip and Au contact. i, current flow through the tip. R and Ox represent the reduced and oxidized forms of an electroactive species. ⊕ and ⊝ represent cations and anions in the liquid layer and in the mica sheet.

