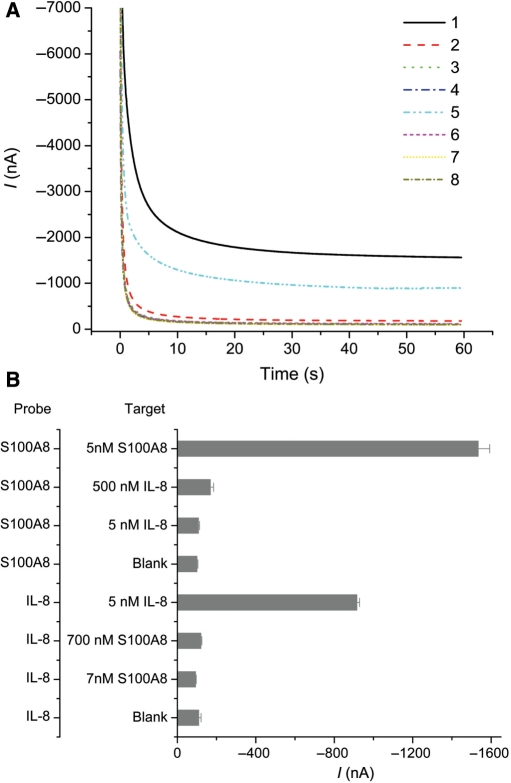
Figure 3.
Cross-detection with two sets of IVT RNA applying HP: IL-8 and S100A8. (A) The amperometric signals for eight samples. (1)–(4) applied HPs for S100A8 and the targeting RNA were (1) 7 nM S100A8, (2) 500 nM IL-8, (3) 5 nM IL-8 and (4) buffer only, respectively. (5)–(8) used HPs for IL-8, and the targeting RNA were (5) 5 nM IL-8, (6) 700 nM S100A8, (7) 7 nM S100A8 and (8) buffer only, respectively. (B) Bar charts of the same eight samples in (A). The sequences for HPs are listed in Table 1 as IL-8 HP and S100A8 HP. Mean and SD of four individual experiments are shown.

