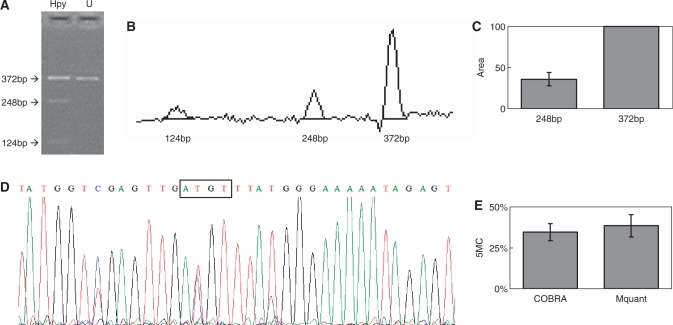
Figure 1.
Gel electrophoresis for quantification of DNA methylation by COBRA, a scan of this gel and a corresponding electropherogram from the same amplificate analyzed by Mquant. (A) A bisulfite PCR product was digested with HpyCH4IV (ACGT) to give three bands of 372, 248 and 124 bp. The 372-bp band is undigested DNA (representing unmethylated DNA that now has an ATGT site). The smaller bands represent methylated DNA whose single HpyCH4IV site was cleaved. The digested DNA lane is marked Hpy and the undigested DNA lane is marked U. (B) A scan of the digested lane of this gel. (C) The peak areas of the 372- and 248-bp bands from four determinations were quantified and their relative peak areas are shown (with 372 bp areas normalized to 100). (D) The T trace of the electropherogram was analyzed by Mquant as described in the text. (E) The relative copy numbers of the 372- and 248-bp bands were used to calculate the percent DNA methylation (5MC) of the original DNA. The percent methylation by Mquant is also shown. Analyses of this individual PCR amplificate gave a mean percent methylation (±SD) by COBRA of 34.6 ± 5.2% with a CV of 15% (n = 4) and a mean percent methylation by Mquant of 38.4 ± 6.8 with a CV of 18% (n = 4). The differences in the two methods for this amplificate are not statistically significant (P = 0.40) and are <4% methylation (35 versus 38%).

