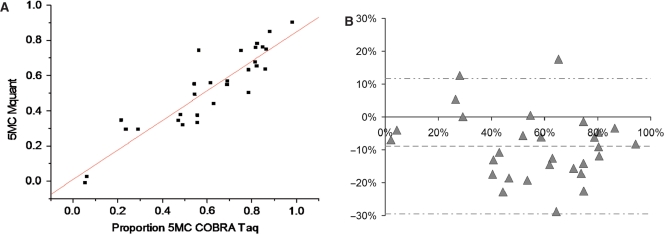
Figure 4.
(A) A plot of the percent DNA methylation on the CpG of a TCGA site from 29 different DNA samples determined by COBRA versus the percent methylation on this same site determined by peak areas on forward sequence electropherograms. The results of the two methods are highly correlated (R = 0.91, P = 7.0 × 10⁻¹²), but in rather poor agreement (estimate ± standard error = 0.84 ± 0.073 for the slope, and 0.009 ± 0.048 for the y-intercept). The average percent methylation measured by COBRA and Mquant were 61% and 52%, respectively. (B) A Bland-Altman plot of the data shown in (A). The vertical axis shows the difference in methylation values measured by the two methods (Mquant minus COBRA), whereas the horizontal axis shows the average methylation value measured by the two. The mean (SD) of the difference between methods was −8.9% (10.3%), indicating statistically significant evidence (P < 0.0001) of a bias toward lower values as measured by Mquant compared to COBRA. The center dashed horizontal line shows the mean difference, while the outside horizontal lines show the 95%LoAs (at −29.5%, +11.7%).

