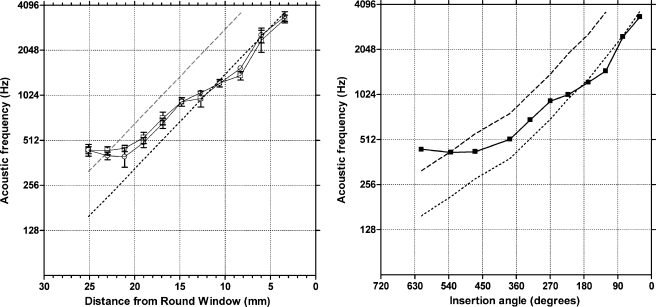
FIG. 4.
Pitch matches for high-rate electrical stimulation as a function of electrode position (in mm) from the round window (a) and as a function of insertion angle (b). In a, results from two test runs are plotted. The averaged data are plotted in b. Error bars=± 1 standard deviation. The dashed line indicates the Greenwood frequency-place function. The dotted line lies one octave lower than the Greenwood function.

