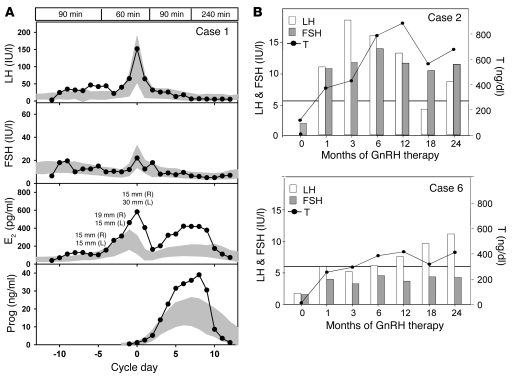
Figure 3. Response to GnRH therapy in 3 probands harboring an FGF8 mutation.
(A) Pulsatile GnRH was administered at a dose of 100 ng/kg i.v. at a physiologic frequency to the proband described in case 1, demonstrating a normal increase in LH and FSH, an increase in E2 consistent with development of 2 follicles, and an increase in progesterone (Prog) consistent with ovulation. Data are centered to the day of ovulation (0 d); for E2, follicle diameters are indicated; shaded areas represent mean ± 1 SD hormone levels in 109 control women; boxed regions at top denote GnRH pulse frequency. (B) LH, FSH, and T responses to GnRH therapy in 2 male patients (cases 2 and 6). Horizontal lines denote lowest value of the normal range for adult serum T levels. To convert serum T values from ng/dl to nmol/l, divide by 28.84.

