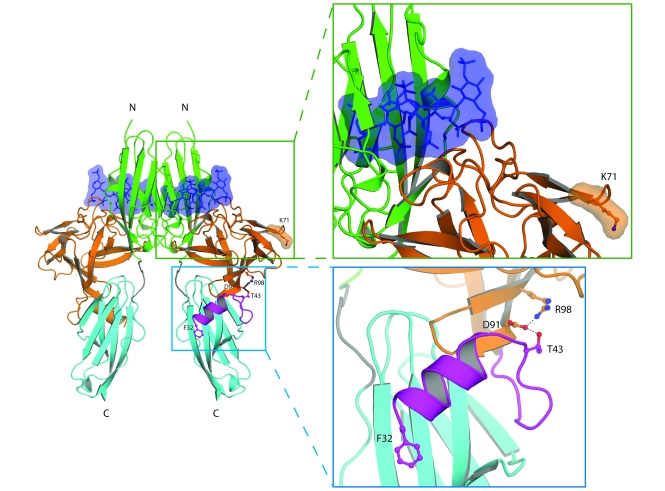
Figure 4. Structural modeling of K71E and R98G FGF8 mutations predicts that they are loss-of-function mutations.
The locations of the mutated FGF8 residues are mapped onto the ribbon diagram of 2:2:2 FGF8b/FGFR2c/heparin complex. Orange and purple denote the core and N terminus, respectively, of FGF8b. Green, cyan, and gray denote D2, D3, and D2-D3 linker, respectively, of the extracellular FGFR2c ligand-binding region. The 2 heparin oligosaccharides are rendered as blue sticks and surface representations. Also shown are detailed views of the regions where the mutated FGF8 residues are located. Selected residues are shown as ball-and-stick representations, as is F32 of FGF8b N terminus to underscore the importance of the FGF8b N terminus in FGF8b-FGFR binding. Blue balls, nitrogen atoms; red balls, oxygen atoms. Hydrogen bonds are shown as dashed lines. The N and C termini of polypeptide chains are indicated.

