
Figure 3. Functional Connectivity Defines Separate Dorsal and Ventral Networks.
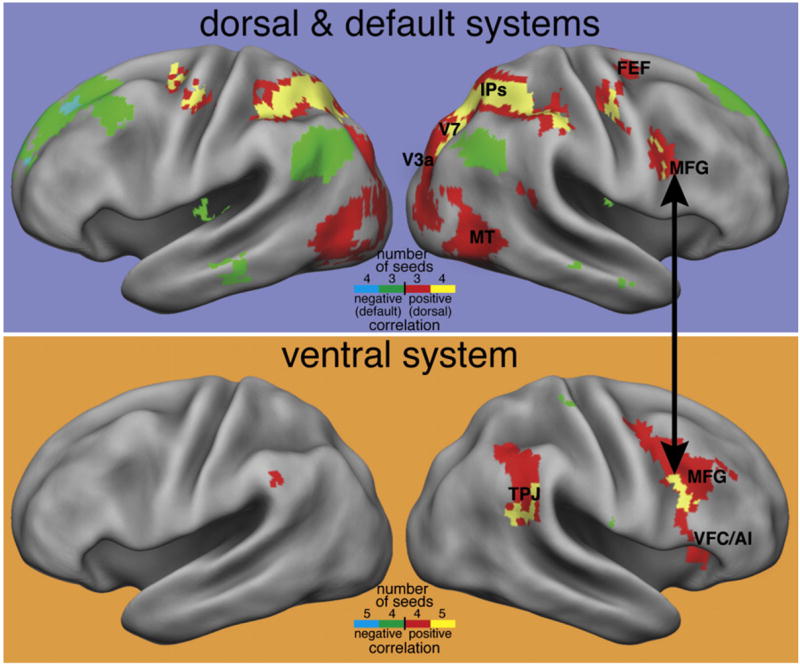
(Top panel) Four dorsal frontoparietal regions from the meta-analysis of activation studies shown in Figure 2 were used as seeds in an FC analysis of resting-state data. The map indicates regions that showed significant positive correlations with three (red) or four (yellow) of the seed regions. The dorsal network is largely reproduced in the resting-state FC maps. Regions that show significant negative correlations with three (green) or four (blue) of the seed regions are also shown and roughly reproduce the default network, possibly indicating a push-pull relationship between the two networks. (Bottom panel) Five ventral regions from Figure 2 were used as seeds for an FC analysis. Regions showing consistent positive correlations largely reproduce the ventral network, but negative correlations in default regions are not observed. The black arrow indicates that posterior MFG near the inferior frontal sulcus appears to be connected to both networks.