
Figure 6. Interaction of Dorsal and Ventral Attention Networks.
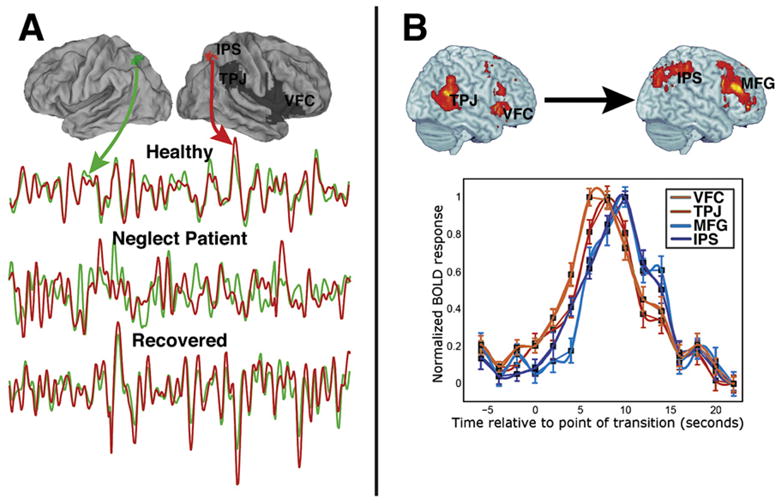
(A) The surface-rendered brains show the damaged right hemisphere regions (in dark gray) of a stroke patient with spatial neglect. The bottom graph shows the time course of BOLD activity in undamaged regions of IPS, with the green and red lines indicating, respectively, the time series for the indicated left and right IPS regions. Time courses from these regions are shown for a healthy subject, for the stroke patient immediately following the stroke, and for the same patient following recovery. While the healthy subject and the recovered stroke patient show highly correlated interhemispheric IPS activity, the same patient immediately after the stroke shows activity that is much less correlated. Therefore, damage to ventral regions, possibly including white matter tracts, impairs physiological interactions between undamaged dorsal regions (He et al., 2007a).
(B) The surface-rendered brains show ventral (left) and dorsal (right) regions that are activated when the completion of a symphonic movement is detected. The time courses indicate that ventral activations (red lines) preceded the dorsal activations (blue lines), while a Granger Causality analysis of these regions indicated that ventral activity predicted dorsal activity (Sridharan et al., 2007).