
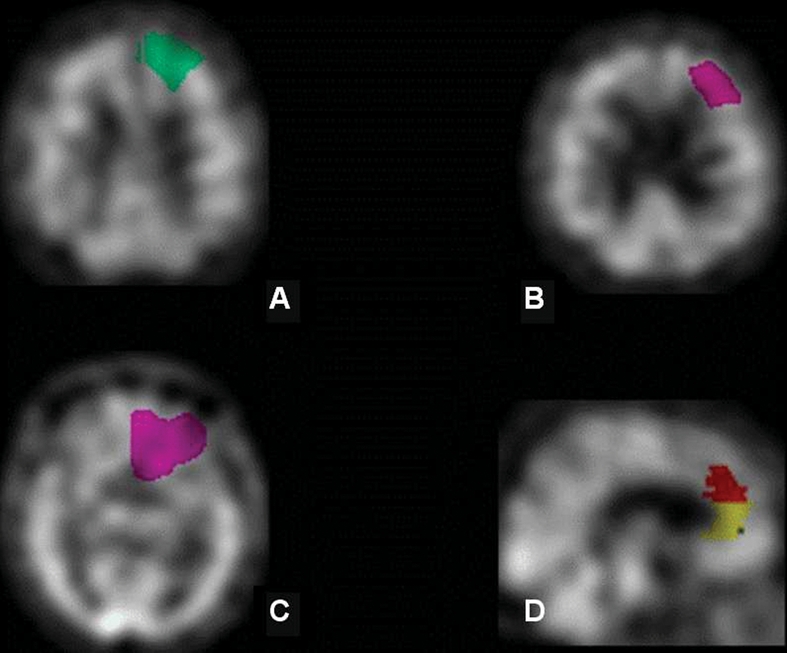
Fig. 1: Frontal regions as defined by the single photon emission computed tomography region of interest template: (A) superior frontal gyrus (BA 8/9), (B) middle frontal gyrus (BA 46), (C) orbitofrontal cortex (BA 11), (D) anterior cingulate cortex (BA 25/24). BA = Brodmann's area.