
Fig. 1.
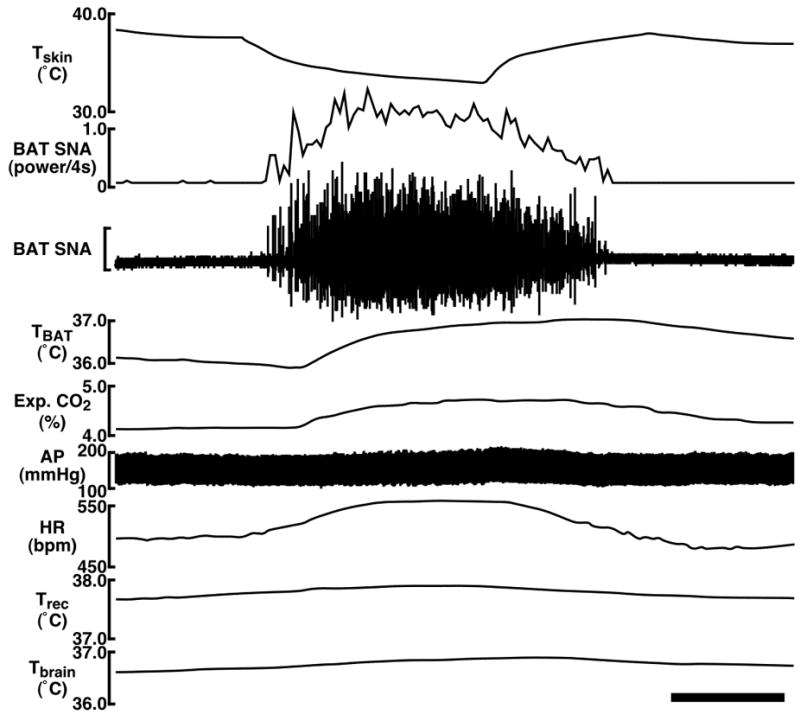
Changes in BAT SNA, TBAT, expired (Exp.) CO2, HR, arterial pressure (AP), Trec, and Tbrain in response to cooling the trunk skin. The horizontal scale bar represents 100 sec, and the vertical scale bar for the BAT SNA trace represents 100 μV. Note that Trec and Tbrain do not change substantially during the skin cooling and rewarming, indicating that the observed changes in BAT SNA, TBAT, Exp. CO2, HR, and AP were evoked by the effect of skin temperature changes rather than changes in body core parts or in the brain.