
Fig. 1.
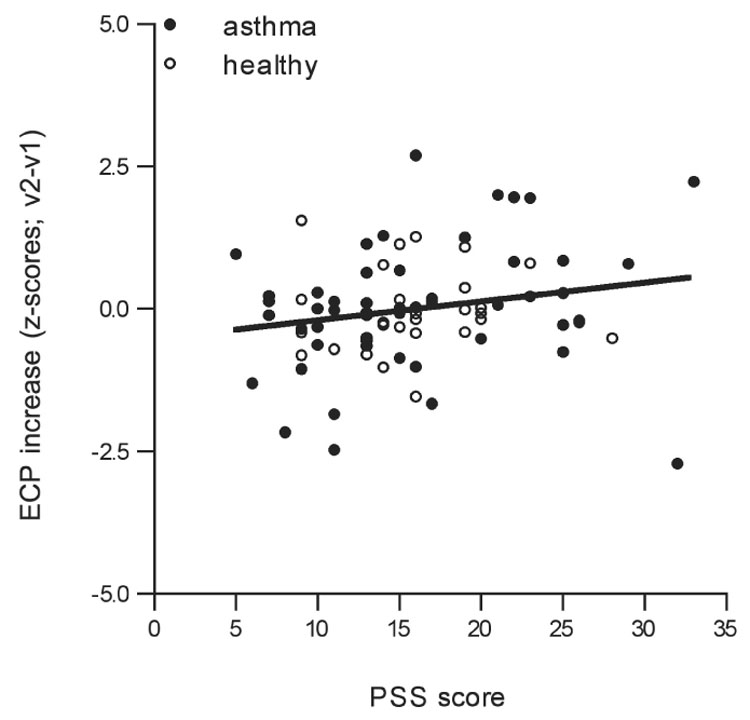

Fig. 1A. Scatterplot of parent perceived stress (PSS) predicting changes over time in ECP levels in children with asthma (filled circles) and healthy children (clear circles; PSS: p = .004, group: p = .42). Regression line is shown for the total group, i.e., including both children with asthma and healthy children.
Fig. 1B. Scatterplot of parent perceived stress (PSS) predicting changes over time in IL-4 production in children with asthma (filled circles) and healthy children (clear circles; PSS: p = .019, group: p = .58). Regression line is shown for the total group, i.e., including both children with asthma and healthy children.