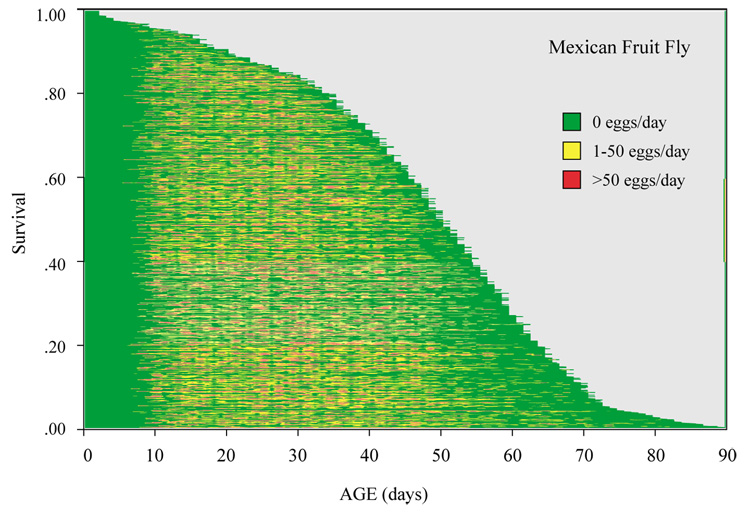
Fig. 3.
Event-history diagrams (Carey et al., 1998b) visualizing the demographic response of individual Mexican fruit fly females. Each horizontal line denotes a female ‘life line’, the length of which is proportional to her life span. The age-specific egg laying intensity of each of the 1151 flies corresponds to the shading: green=zero eggs/day; yellow=1–50 eggs/day; red=>50 eggs/day. Graphic depicts information on 1.6 million Mexfly eggs distributed over 31,000 egg-laying days. (For interpretation of the reference to colour in this legend, the reader is referred to the web version of this article.)

