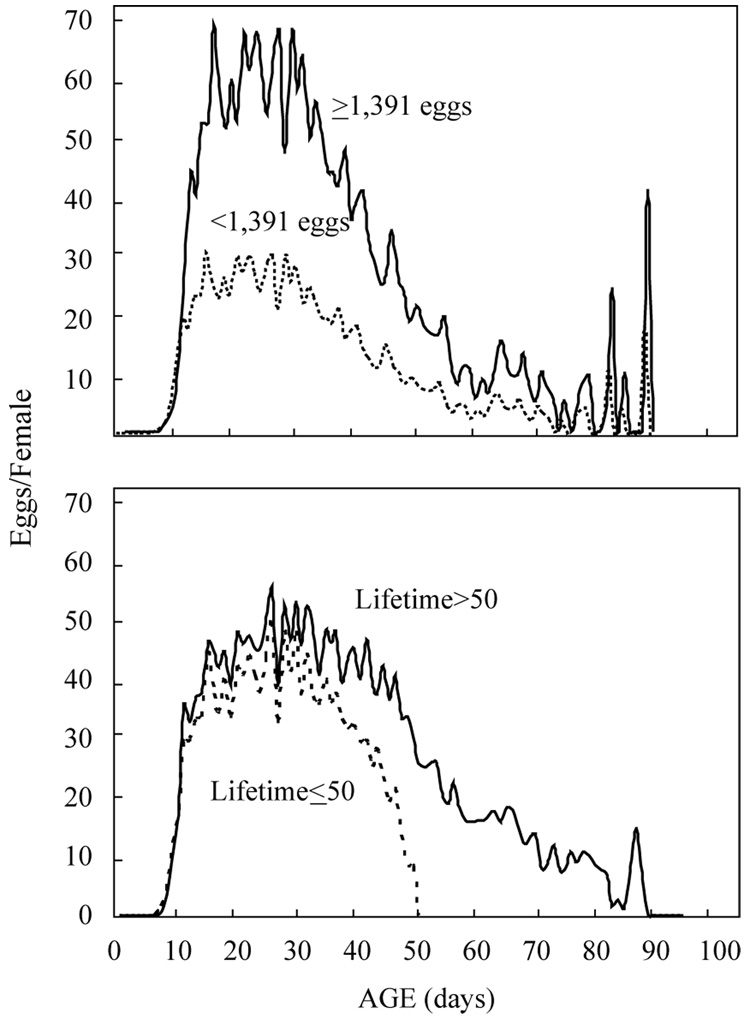
Fig. 6.
Age schedules for subcohorts of Mexfly females disaggregated according to either total lifetime eggs (top) or lifetime (bottom). Solid lines depict reproduction in females that produced≥1391 eggs in their lifetime (top) or lived>50 days (bottom). Dashed lines depict the same relationships except for females that laid<1391 eggs or lived≤50 days, respectively. Note that the age patterns (e.g. peaks) for each of the subcohorts in both the top and bottom graphs are similar.

