Figure 1.
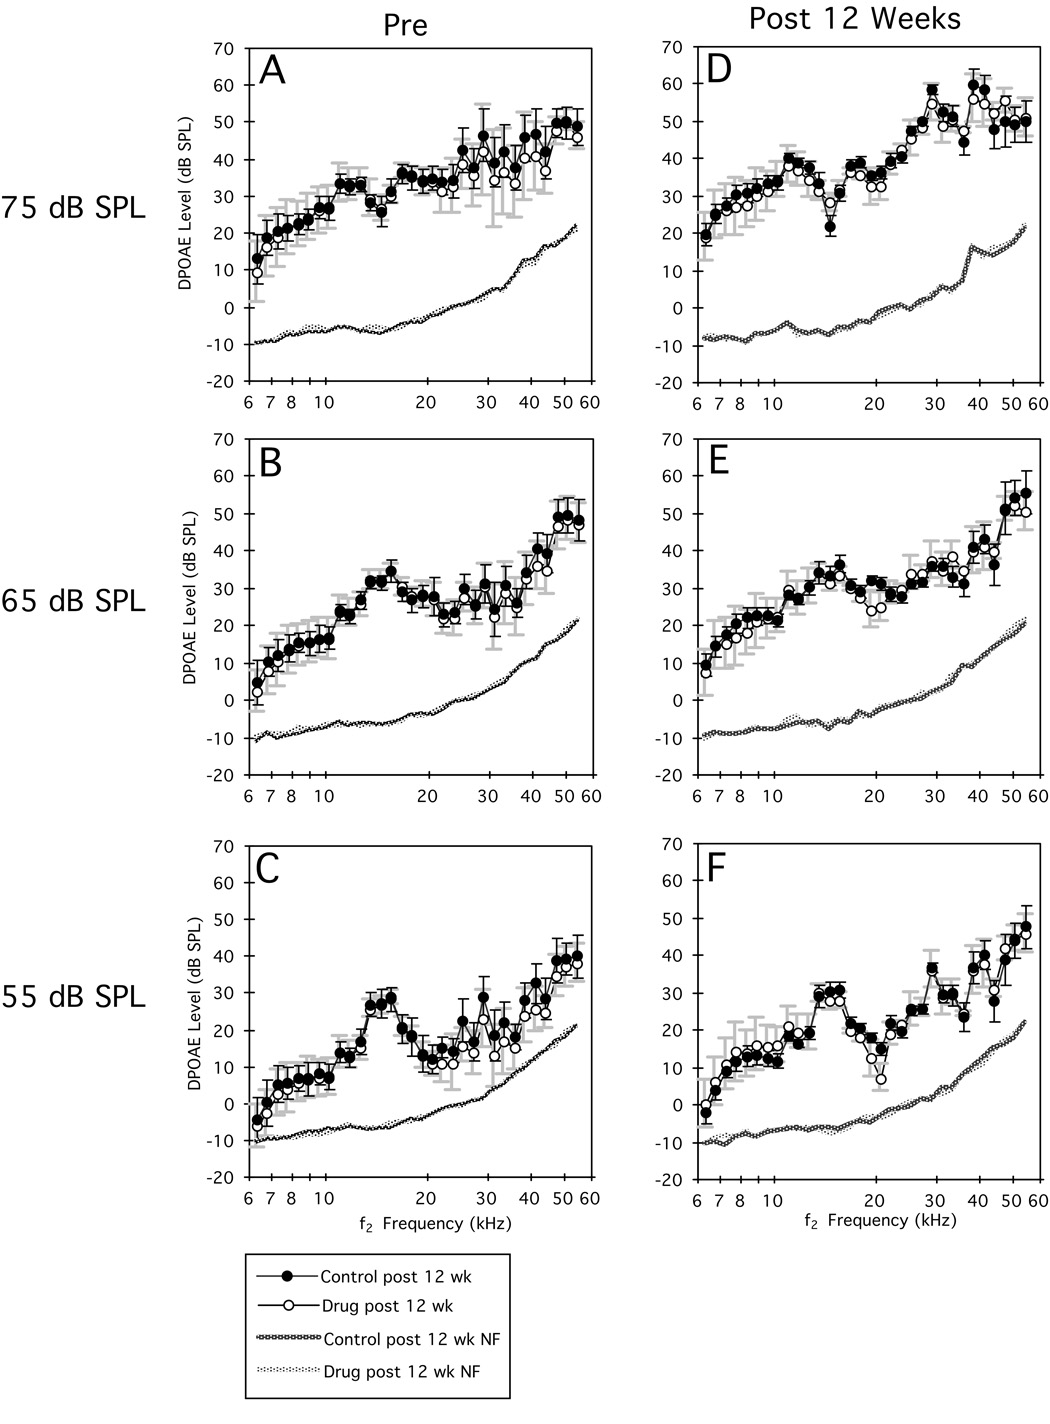
Mean DP-grams (±1 SD) collected at three primary-tone levels before (A–C) and after (D–F) 12 wk of NRTI treatment for untreated control (solid circles) and drug-treated (open circles) mice. From inspection of these plots, it is clear that the two groups of mice exhibited similar pre-treatment (left panels) DPOAE levels, and that these measures were basically unchanged at the end of the drug-treatment period (right panels). Dotted lines at the bottom of each plot indicate the related NFs of the measurement system.

