
Figure 3.
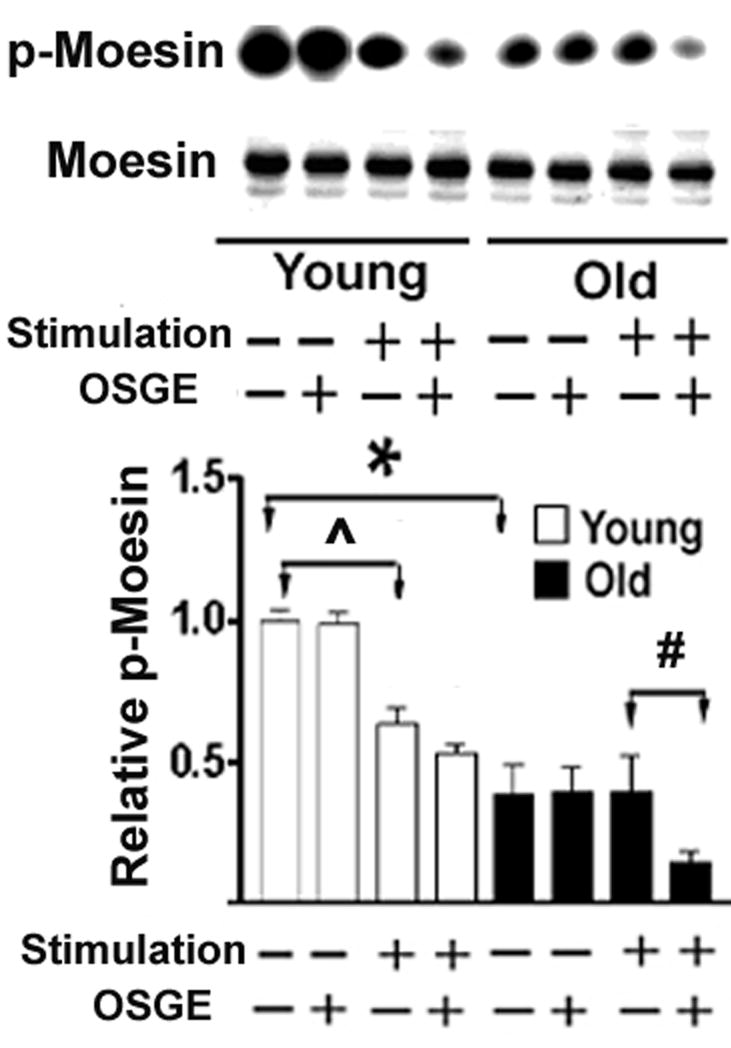
Analysis of the phosphorylation status of moesin in CD4 T cells from young and old donors. CD4 T cells from CB6F1 mice were treated with OSGE or left untreated, and aliquots were then stimulated through the TCR. Lysates were evaluated by immunoblotting using antibodies specific for p-moesin or for moesin and ezrin. The amount of moesin was used to normalize the amount of p-moesin in each sample. The bar plot represents the mean and SEM of 7 young (open bars) and 5 old (closed bars) mice from 5 independent experiments. Groups indicated by (* ˆ #) are different at a significance level of p < 0.05.