1.
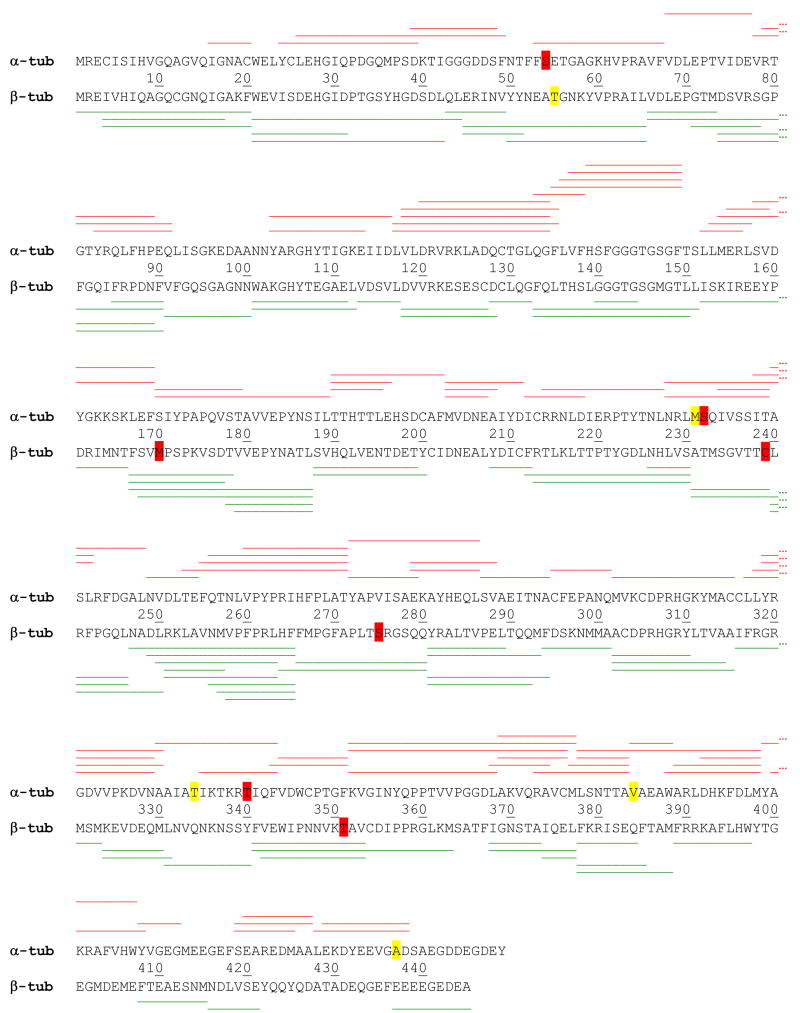
Peptide map displayed in red on α-tubulin, top sequence (UniProt P81948, bovine I-C chain) and in green on β-tubulin, bottom sequence (UniProt Q6B856, bovine, II-B chain). Yellow highlighted residues represent deviations from these sequences detected in the MS/MS peptide sequence data, arising from a different isotype. Red highlighted residues represent the detection of an additional isotypes in the sequence data.

