7.

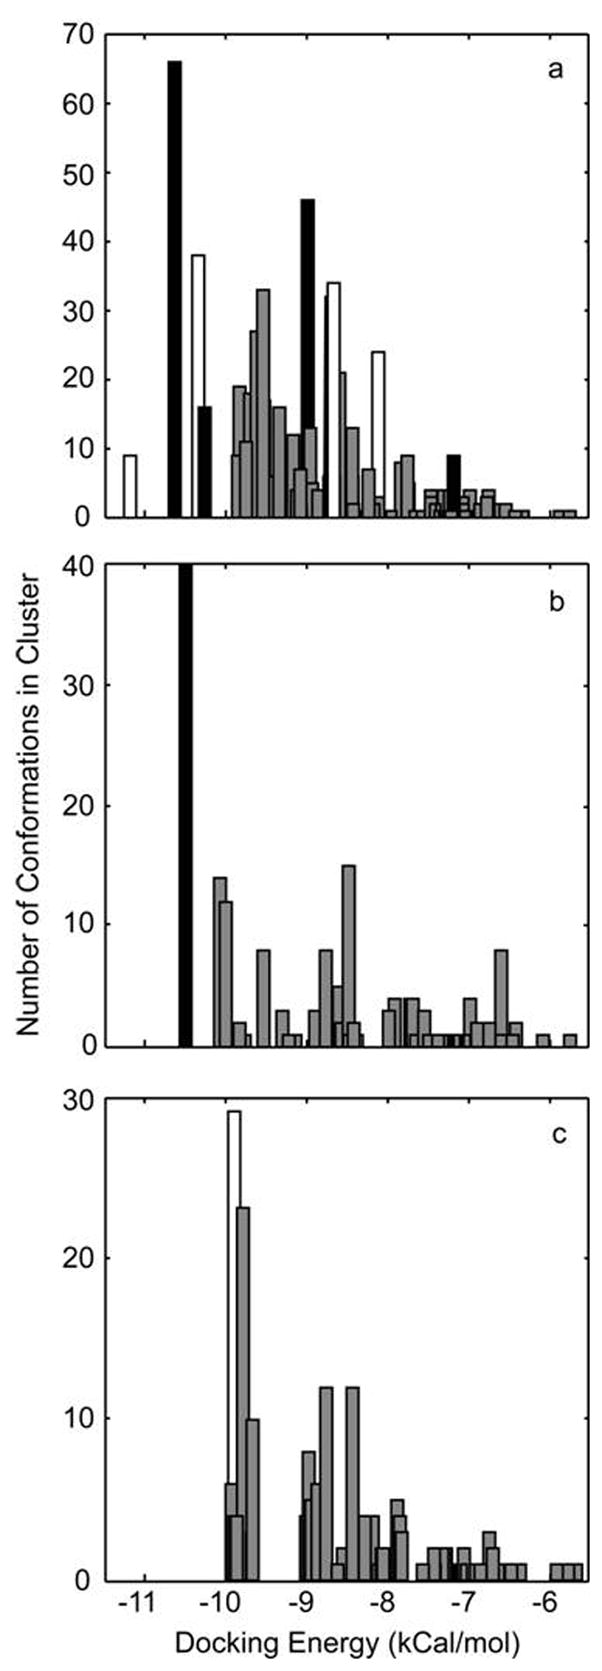
Histogram of docking energies returned from the ligand docking simulations, using the coordinates for bound peloruside and 1TVK. (a) Results from a blind docking exercise targeting the exterior surface of an α-β-α protofilament with clustering of poses at the 5Å level, where black represents poses within the region defined by the HDX data at the β-tubulin site, white the region defined by the interdimer site and gray the binding poses outside of the regions indicated by the HDX data; (b) Results from the directed docking to the general region of the exterior of b-tubulin with clustering of poses at the 2Å level, where black represents the pose displayed in Fig. 8 and gray alternative poses within or around site identified by HDX data; (c) results from the directed docking to the general region of the exterior of the α-β interface with clustering of poses at the 2Å level where white represents the best-fit to the HDX data and gray alternative poses within the interfacial region.
