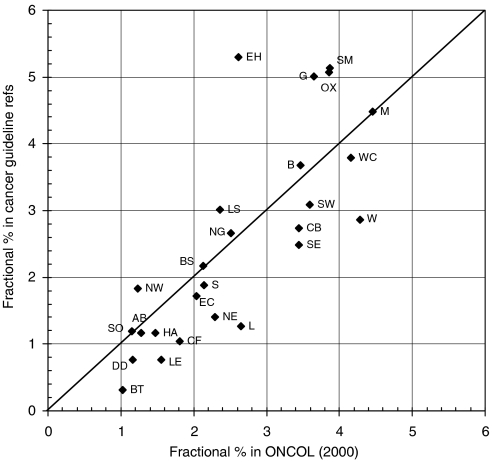
Figure 4.
Scatter plot of the fractional count percentage presence of the leading 26 UK postcode areas within the UK papers cited on the UK cancer clinical guidelines plotted against their percentage presence in the UK oncology research outputs in 2000. Codes: AB=Aberdeen, B=Birmingham, BS=Bristol, BT=Belfast, CB=Cambridge, CF=Cardiff, DD=Dundee, EC=London EC (St Bart's), EH=Edinburgh, G=Glasgow, HA=Harrow, L=Liverpool, LE=Leicester, LS=Leeds, M=Manchester, NE=Newcastle upon Tyne, NG=Nottingham, NW=London NW (Royal Free), OX=Oxford, S=Sheffield, SE=London SE (Guys, Kings and St Thomas'), SM=Sutton and Cheam (Institute of Cancer Research), SO=Southampton, SW=London SW (St George's), W=London W (Imperial), WC=London WC (UCL).

