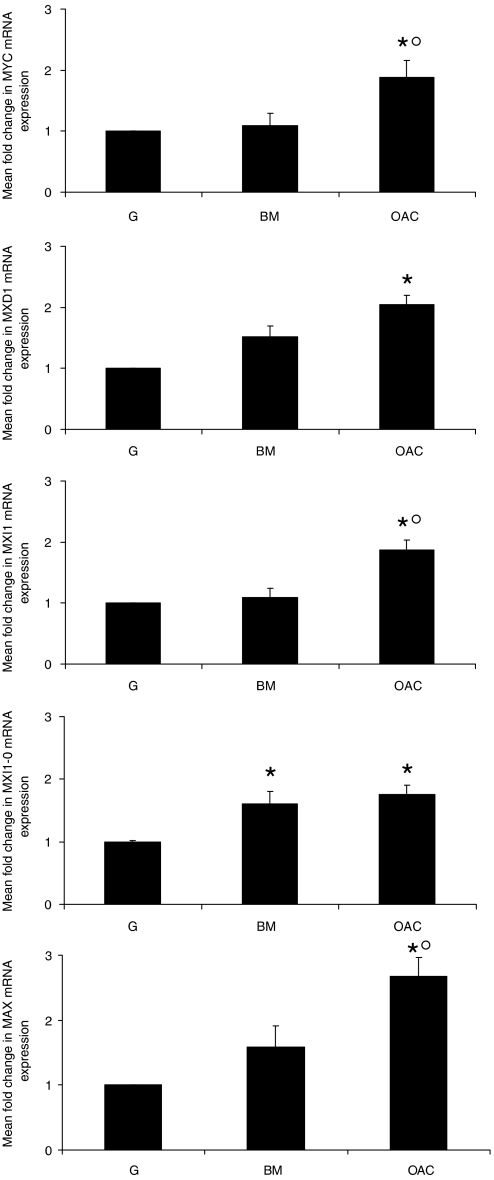
Figure 1.
mRNA expression of MYC/MAX/MAD network genes in Barrett's metaplasia and oesophageal adenocarcinoma. qRT–PCR was used to examine expression of genes encoding c-MYC, MAD1, MXI1, MXI1-0 and MAX in Barrett's metaplasia (BM n=25) and oesophageal adenocarcinoma (OAC n=37). Graphs represent mean fold change relative to matched normal gastric control (G, normalised to one) ±1 s.e.m. * denotes significant change relative to G, ° denotes significant difference between BM and OAC (P<0.05).

