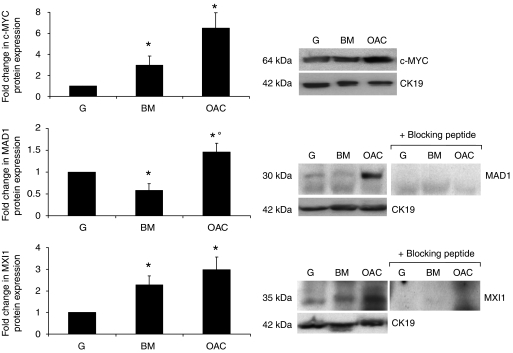
Figure 2.
MYC/MAX/MAD network protein expression in Barrett's metaplasia and oesophageal adenocarcinoma. Expression of c-MYC, MAD1 and MXI1 protein was examined in Barrett's metaplasia (BM n=6) and oesophageal adenocarcinoma (OAC n=15) with matched normal gastric mucosa (G) by western blotting. Immunoreactive bands were assessed by semi-quantitative densitometry. Expression in BM and OAC is expressed relative to G (normalised to one); cytokeratin 19 (CK19) was employed for normalisation of protein loading. A representative western blot for each protein is shown alongside densitometry data representing mean expression change ±1 s.e.m. * denotes significant change relative to G, ° denotes significant change between BM and OAC.

