
Figure 3. Population genetic history of human influenza A virus.
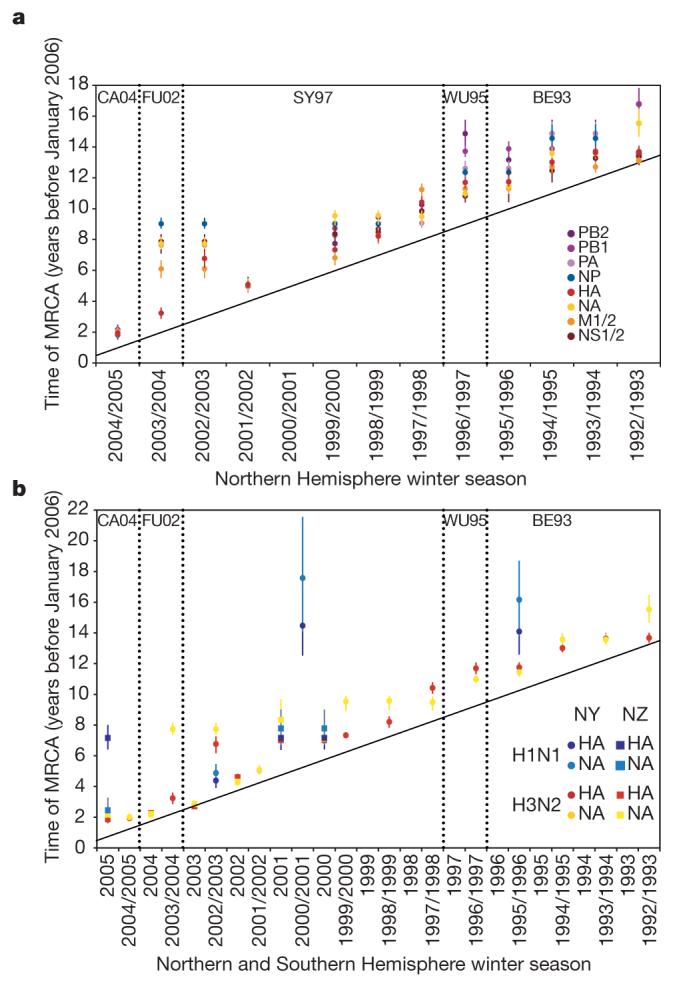
a, b, Time to the most recent common ancestor (TMRCA) of each genomic segment for A/H3N2 isolates circulating each season in New York state (a) and HA and NA genomic segments for the A/H3N2 and A/H1N1 isolates circulating in New York state and New Zealand (b). The values shown represent the mean and 95% highest posterior density intervals for TMRCAs estimated across the trees sampled using bayesian MCMC analyses. Explicit posterior probabilities of whether any season has a TMRCA that is older than that of each preceding season are given in Supplementary Table 1. The diagonal line goes through 1st January of each season (1st July for New Zealand), approximating the seasonal mid-point. The timescale of major changes in antigenic (HA) type in the United States is also depicted. In the Northern Hemisphere, individual influenza seasons straddle two years, whereas in the Southern Hemisphere they are contained within one calendar year.