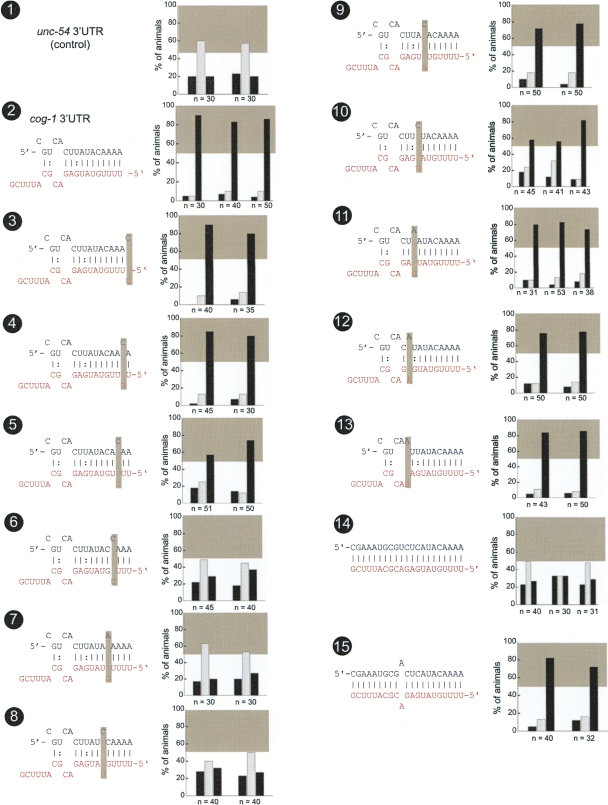
FIGURE 2.
Mutational analysis of lsy-6 site #1. Multiple transgenic animals expressing one given sensor construct are scored for gfp expression. Each scored animal is placed into one of three categories, in which relative gfp expression in the two ASE neurons is as follows: ASEL>ASER (left black bar), ASEL=ASER (middle gray bar), or ASEL<ASER (right black bar). See Material and Methods for more details on scoring. Each set of three bars represents an independent transgenic line. The gray box shown in each bar graph is a visual “helper” to indicate what is considered to be a minimal level of regulation for the system; this minimal regulation is arbitrarily defined based on the level of regulation seen with the lsy-6 site #2 deletion, shown in Figure 4, no. 4. The gray box roughly correlates with another quantitative measure for the degree of regulation, called the “asymmetry index,” defined in the Material and Methods and listed in Supplemental Table 1 for each construct analyzed in this paper. Each construct is named based on figure number and number of construct within the figure. The control unc-54 3′ UTR sensor construct displays characteristic unregulated distribution of gfp (no. 1), while the cog-1 3′ UTR sensors display dramatic regulation with the majority of animals falling into the ASER>ASEL category (no. 2). Shaded boxes indicate location of introduced mismatches. Only mismatches in positions 4, 5, and 6 counting from the 5′ end of the miRNA resulted in complete loss of regulation (nos. 6,7,8). Mismatches in positions 1, 2, 7, 9, 10, and 11 resulted in little or no loss of regulation (nos. 3,4,9,11–13). Mismatches in positions 3 and 8 resulted in a moderate loss of regulation (nos. 5,10). If the lsy-6 target site in the cog-1 3′ UTR is converted to have perfect complementary to lsy-6, then regulation is completely lost. However, if a single mismatch is reintroduced into position 12, which is unpaired in the wild type, then regulation is restored (nos. 14,15). Note: Construct nos. 1, 2, and 7 have been previously examined (Didiano and Hobert 2006) and a rescoring of newly generated and scored transgenic lines is shown here (rescored lines show the same results as previously reported).

