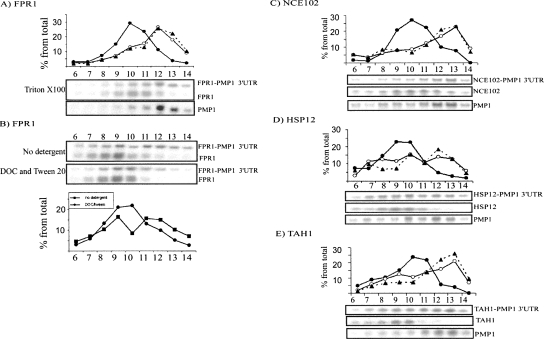
FIGURE 4.
Sedimentation analysis of PMP1 3′-UTR fused to heterologous ORFs. Plasmids expressing the 3′-UTR of PMP1 cloned downstream from the ORFs of (A,B) FPR1, (C) NCE102, (D) HSP12, or (E) TAH1 were transformed into (A,B,E) wild-type cells or into (C,D) deletion strains. The cells were grown in selective media, subjected to polysomal separation on sucrose gradients, and resolved into 14 fractions. The sedimentation position of the mRNAs indicated to the right of each panel was determined by Northern analysis. In A and B, the expression levels and lengths of the mRNAs allowed for simultaneous detection of the fusion and natural transcripts on the same blot. In C–E, the sedimentation of the natural transcript was determined by similar analysis of wild-type cells. In the quantification graphs for panels A and C–E, the closed circles indicate signals of the normal transcripts, open circles represent the signals of the fusion transcripts, and triangles connected by dashed lines represent the sedimentation of the PMP1 transcript. In B, closed squares or circles represent the signals of FPR1-PMP1 3′-UTR in the assay without detergent or with DOC and Tween 20, respectively.

