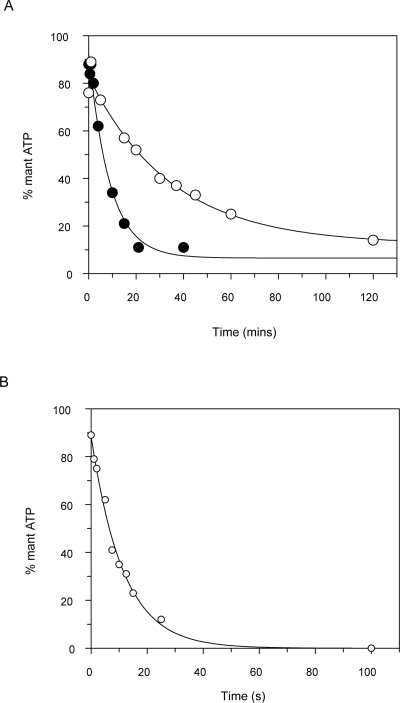
Figure 5.
Cleavage of mantATP by SufC, SufBC, and SufCD. Concentrations are the same as in Figure 4. (A) SufC alone (open circles) and SufCD (filled circles) with data obtained by manual quenching. (B) SufBC with data obtained using a quenched-flow instrument. The percentage of mantATP remaining is plotted against time.

