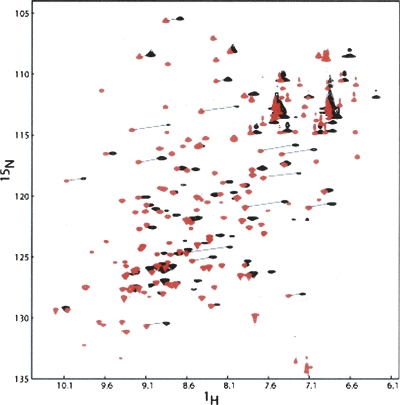
Figure 2.
1H–15N HSQC spectra at a 1H frequency of 600 Hz for 0.3 mM Galectin-3–LBT with 0.3 mM Lu3+ (red) or with 0.3 mM Dy3+ (black). Many peaks disappear for the protein sample with paramagnetic Dy3+. Peak assignments were accomplished by drawing a diagonal line between diamagnetic and paramagnetic peaks as shown in the figure.

