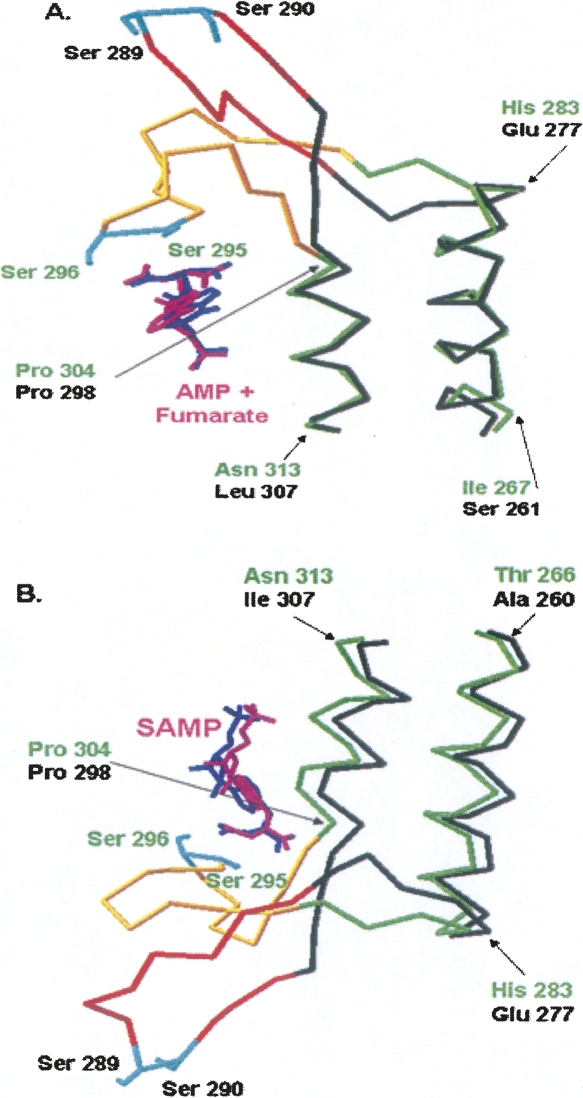
Figure 7.
Structural alignment of human and E. coli ASL crystal structures. (A) Top left active site of human ASL structure of Figure 6A (which contains AMP + fumarate) with the E. coli ASL structure (PDB# 2PTQ). (B) Lower left active site of human ASL structure of Figure 6A (which contains SAMP) with E. coli ASL structure (PDB# 2PTR). The determined human ASL structure is shown in black with the missing loop region modeled and colored in orange (except for Ser289 and Ser290 which are shown in cyan). The E. coli ASL structure, which is completely determined, is shown in green with the established loop region colored in yellow. Ser295 and Ser296 are shown in cyan, for ease of comparison with the modeled human ASL loop region. SAMP, AMP, and fumarate from the human and E. coli structures are shown in pink and blue, respectively.

