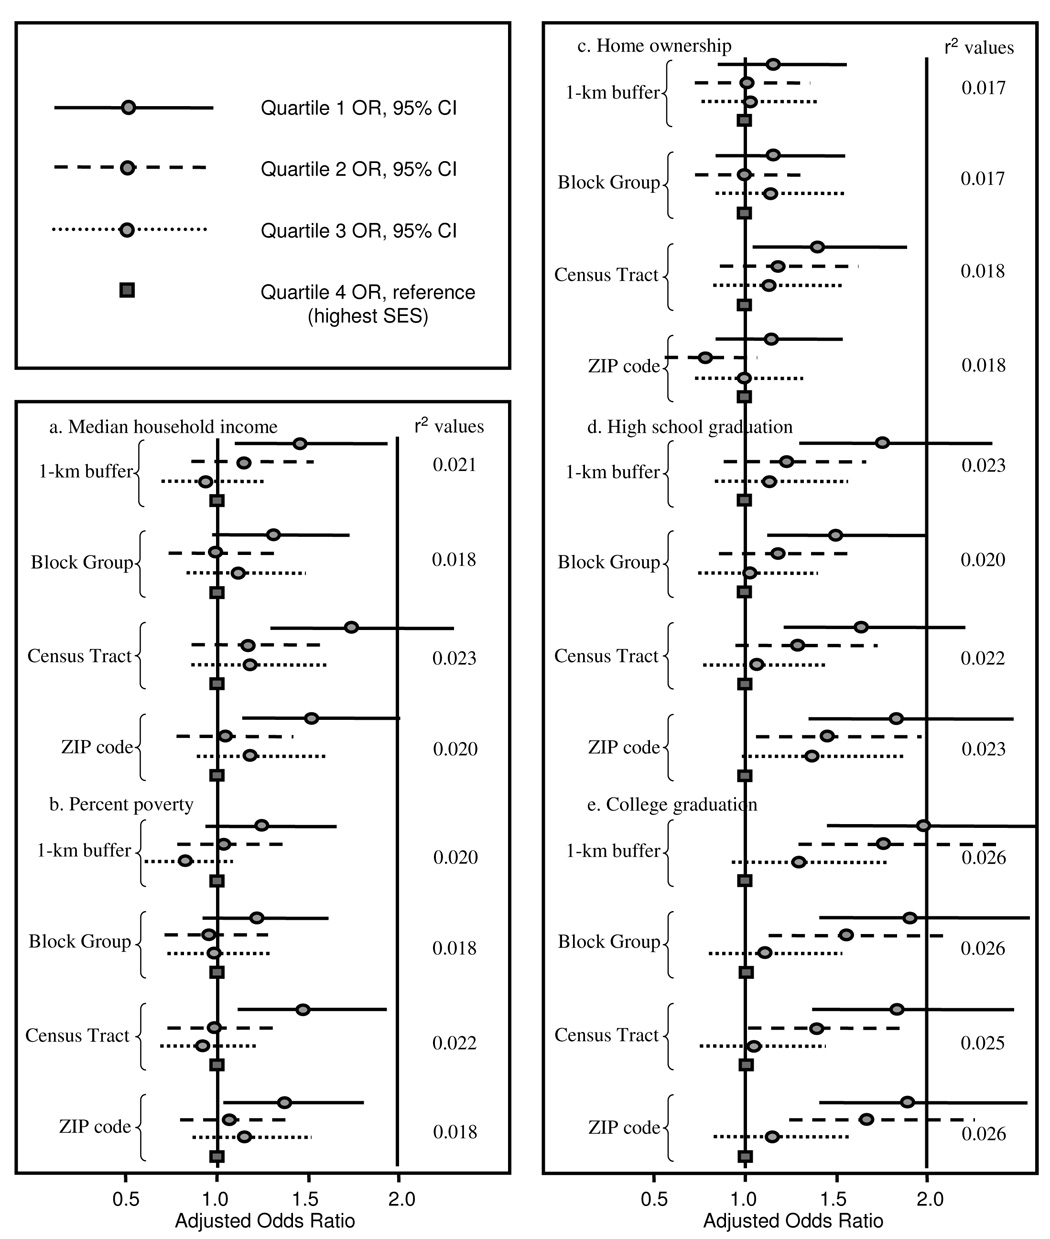
Figure 3. Odds Ratios for Myocardial Infarction by Quartiles of Neighborhood Socioeconomic Characteristics.

Models were adjusted for matching variables (age, sex, hypertension status, calendar year) and demographic characteristics (marital status, and race); pseudo r-squared values for these logistic regression models are shown
