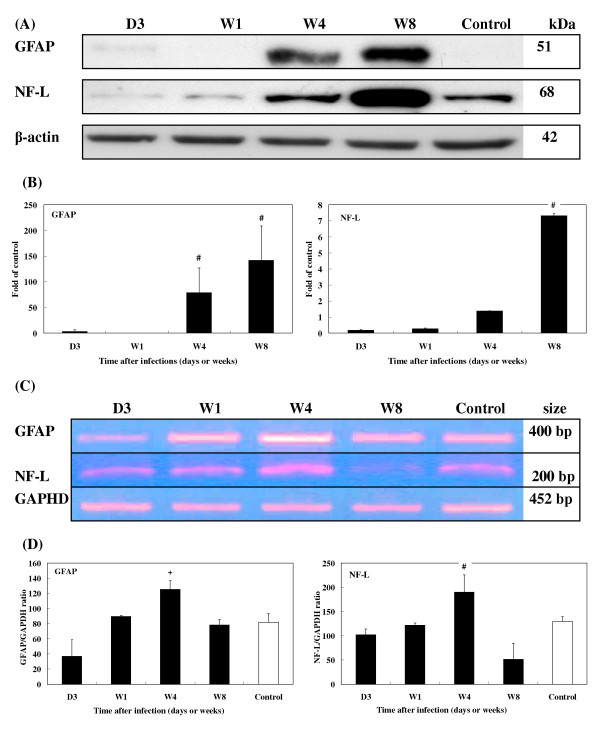
Figure 6.
Expression of GFAP and NF-L in the brains of T. canis infected mice. (A) Protein levels of GFAP and NF-L in the brains of infected mice from 3 dpi to 8 wpi assessed by Western blotting. (B) Relative times were generated as described in Fig. 5B. The error bars indicate the S.D. and the superscript indicates significant differences from the control; #P < 0.001. (C) Expression levels of GFAP and NF-L in the brains of infected mice from 3 dpi to 8 wpi were assessed by RT-PCR. (D) The relative amounts of GFAP and NF-L mRNA were calculated based on the optical density relative to that of the GAPDH. The error bars indicate the S.D. and the superscripts represent significant differences from the control; +P < 0.01, #P < 0.001. Three to eight mice per group were examined.

