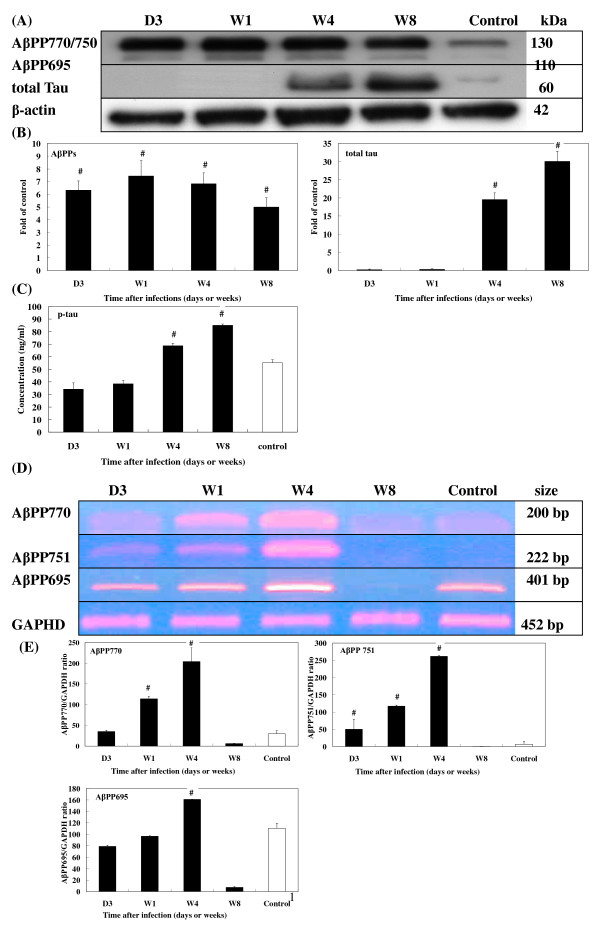
Figure 8.
Expression of AβPP and Tau in the brains of T. canis infected mice. (A) Protein levels of AβPP and Tau in the brains of infected mice from 3 dpi to 8 wpi were assessed by Western blotting. (B) Relative times were generated as described in Fig. 5B. The error bars indicate the S.D. and the superscript represents significant differences to the control; #P < 0.001. (C) Concentrations of phosphorylated Tau in the brains of infected mice from 3 dpi to 8 wpi were assessed by ELISA. The error bars indicate the S.D. and the superscript represents significant differences from the control; #P < 0.001. (D) mRNA levels of AβPP expressions in the brains of infected mice from 3 dpi to 8 wpi were assessed by RT-PCR. (E) The relative amount of AβPP mRNA was calculated based on the optical density relative to that of the GAPDH. The error bars indicate the S.D. and the superscript represents significant differences from the control; #P < 0.001. Three to eight mice per group were examined.

