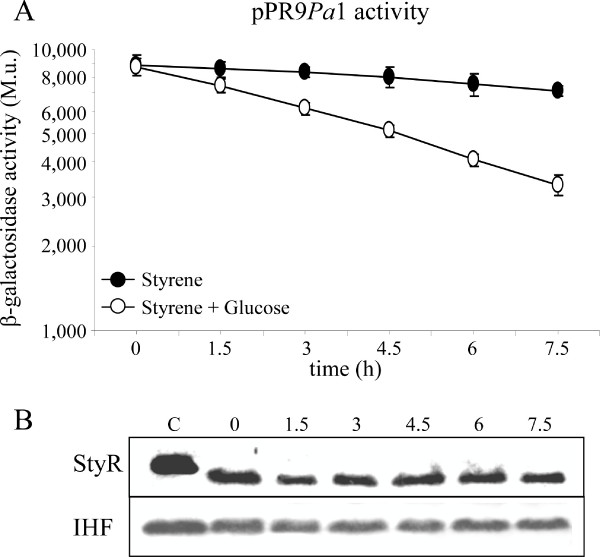
Figure 6.
Analysis of StyR and IHF protein levels. (A) β-galactosidase assays performed with P. fluorescens ST strains carrying the pPR9Pa1 plasmid (Table 1), grown in styrene (filled circles) and styrene plus 0.4% (wt/vol) glucose (open circles), along the growth curve. (B) Western hybridization performed with anti-StyR and anti-IHF antibodies on the cellular soluble fractions derived from the styrene plus glucose culture. Sampling times are indicated above the bands, and correspond to the sampling times of the β-galactosidase assays shown in (A); lane C, control with purified StyR and IHF proteins.

